CarMax Crash … What’s Next ?

First, The Dead Cat Bounce …

What was said back then

“As the economy (if you can call it that) falls off the cliff, one of these two (KMX, CVNA), is not likely to survive.”

It looks like Carvana is swirling down its ‘disruptive’ vending machine wormhole, leaving CarMax to pick up whatever’s left of the car ‘consumer’.

The latest earnings release of KMX, confirms what’s left of the typical consumer’s purchasing power, is evaporating if not completely gone.

Still Clueless …

It’s not necessarily the linked earnings report on KMX that’s important, but the comments.

We’ll not call out any specific one but after reading them, there’s an uneasy sense, the typical American is still wandering around in a type of hypnotic, delusional state, namely, mass psychosis.

They’re stunned … ‘looking for the bottom’.

Everyone has their own timeframe but let’s see where an ultimate bottom for KMX, might be on the charts below.

CarMax, KMX, Yearly Chart

The big … big picture

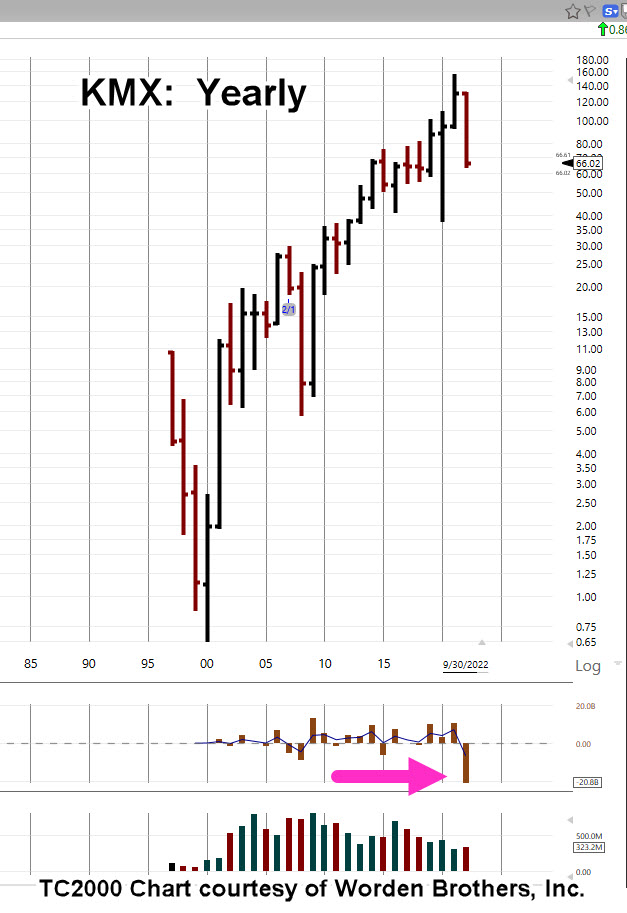
There are three-months left in the year but already the thrust energy lower (magenta arrow) for KMX, is the highest in nearly 26-years of data presented.

Not even the ’08 – ’09, meltdown had downside energy anywhere close to what’s happening now.

That’s a clue in itself, we’ve got a long way to go.

How long, is long?

The quarterly chart of KMX gives us a clue where we might see a ‘bottom’.

CarMax, KMX, Quarterly Chart

Above, we’ve got a terminating wedge (blue lines) that’s been decades in the making.

As the magenta arrow shows, there could be small blip up to resistance in the 85-area before potentially rolling over into a descent that projects to the 4.00, level.

If and when that happens, CarMax rival Carvana, may be long gone; its disruptive vending machines possibly being used as homeless shelters or insect farms.

Stay Tuned

Charts by StockCharts

Note:  Posts on this site are for education purposes only.  They provide one firm’s insight on the markets.  Not investment advice.  See additional disclaimer here.

The Danger Point®, trade mark: No. 6,505,279

Fractal Symmetry … & … Biotech

Repeating & Infinitely Complex

Broccoli

Every market has its own characteristics; patterns that repeat.

Biotech (SPBIO) is no different.

Based on its own repeating fractal characteristics, probabilities continue to point to the downside; but first, the ‘reset’.

Out Again, In Again

Everyone has their own style, risk, and pain tolerance.

What’s presented on these posts is NOT financial advice.

It is however, how one professional is approaching, managing, and positioning in what may go down in history as the largest financial, societal, and political collapse ever.

Let’s not lose sight of that ‘macro’ condition.

It’s difficult to grasp the enormity. The ‘pundits’ are already looking for a ‘bottom‘; a bottom that in reality, is probably years if not decades away.

This past Friday, saw a complete exit of the short position LABD-22-05 & TDA-LABD-22-02 (not advice, not a recommendation).

As we’ll see below, once SPBIO, price action showed itself to be failing its up-move and subsequently reversing to the downside, the short was re-established: LABD-22-06.

In effect, the entire short trade was ‘reset’.

At the close, LABD-22-06, was well in the green.

By the way, After The Close … was released just before 6:00 p.m. EST, yesterday. That gave anyone who wanted, a two-hour window to position in the after-hours market (not advice, not a recommendation).

Now, on to the fractals.

Biotech SPBIO, Weekly

We’ll go straight to the marked-up weekly.

The Fibonacci retrace tool shows SPBIO, dipped down to 61.8%, before rebounding higher; a deep retrace, indicating overall upside weakness.

The zoom version below shows the detail of price action rebounding off the 61.8%, then going straight to 38.2% before backing-off.

Here’s The Fractal Part (below)

Getting closer-in on this past week’s action, we’ll use an hourly chart.

It shows the closing low on Monday, the rebound from Tuesday through Wednesday, the retrace on Thursday and the Up-Thrust on Friday.

SPBIO, Hourly

And with zoom.

Once again, during the retrace, price action went to the 61.8%, level just like it did on the weekly.

Characteristics repeating on multiple time frames.

Deep retrace typically indicates overall weakness.

Test, Fail, or Not

This coming Monday, anything can happen.

Price action can come back to the up-thrust and then reverse lower: Test.

It can come up and penetrate the up-thrust, moving decisively higher: Fail

It can gap-lower, move lower, never look back: Not.

The Danger Point®

That’s where we are now.

If price action moves decisively higher and penetrates Friday’s high, it then precipitates an exit of the LABD position.

The other two scenarios, indicate maintaining the position; adding to the size as the market allows (not advice, not a recommendation).

Stay Tuned

Charts by StockCharts

Note:  Posts on this site are for education purposes only.  They provide one firm’s insight on the markets.  Not investment advice.  See additional disclaimer here.

The Danger Point®, trade mark: No. 6,505,279