What’s The Market Telling Us?
Every market has its own style.
In the case of biotech, we’ve been attempting to verify a trendline as well as a trading channel.
At this point for XBI, it looks like there are several of each.
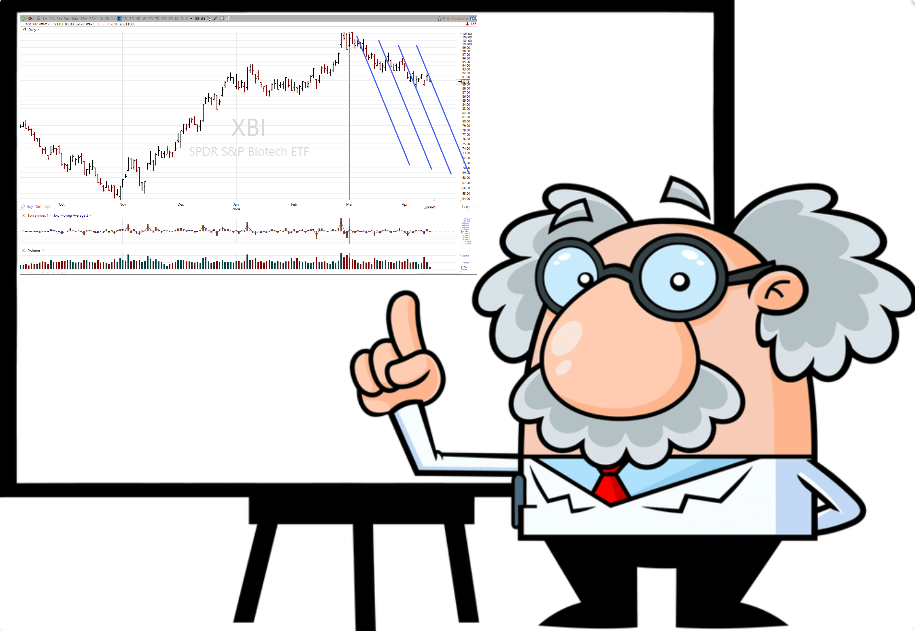
Biotech XBI, Daily
We’ll present the chart with lines, channel(s), and let the viewer decide.
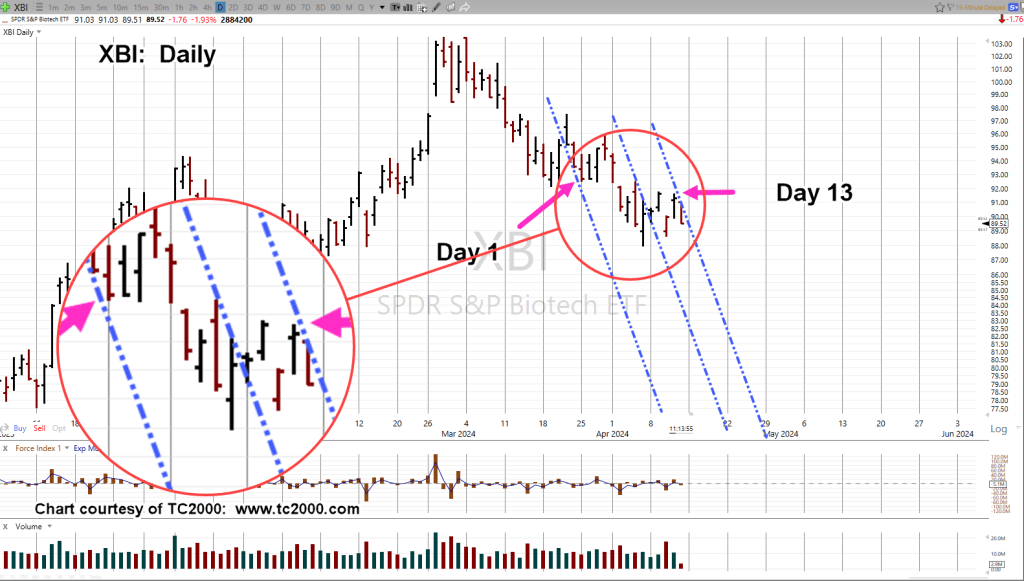
The zoom area shows contact points.
Note, the entire channel is a Fibonacci 13-Days, wide.
Add to that, counting from the left channel line to the center line (contact point), is a Fibonacci 8-Days.
Stopped Short
As always, anything can happen.
If I was short this market, 🙂 , where would I put my stop?
A different way to think about that question, is to ask another question.
At this point in the market action, where would the premise of downward reversal (from testing resistance) be seriously damaged or negated outright?
Looking at the chart, one could reasonably say, the answer is yesterday’s high (not advice, not a recommendation).
Stay Tuned
Charts by StockCharts
Note: Posts on this site are for education purposes only. They provide one firm’s insight on the markets. Not investment advice. See additional disclaimer here.
The Danger Point®, trade mark: No. 6,505,279

Pingback: The Biotech ‘Blip’ « The Danger Point®