Biotech In Review

In this update, we’ll review the entire biotech (bearish) XBI, set-up.
First: Going way-back to March 10th, this year was this post.
There was potential for a long-term downside reversal in biotech, XBI.
Subsequent price action proved the analysis to be correct; biotech declined significantly, down over 18%, before recovering.
Second: The weekly timeframe Up-Thrust was properly identified as (in Wyckoff terms) there was ‘Sign-of-Supply’, with price action in decline.
Third: If, and it’s a big if, we’re in a long-term reversal, we’ve had the initial Sign-of-Supply that’s been followed by an apparent test.
That’s where we are now, as shown in the weekly chart.
Biotech XBI Weekly (inverted)
The chart is inverted so Sign-of-Supply becomes Sign-of-Demand.

Note the MACD is very close to a crossover.
Doing so, would put a serious dent in the ‘Spring, Demand and Test’ assessment.
Now, on to the Daily
Fourth: Buried within the weekly action, ‘Demand and Test’ (inverted chart) is the Daily, with its own set-up.
Biotech XBI, Daily (inverted).
With the weekly in a potential ‘test’, the daily has formed a spring set-up.
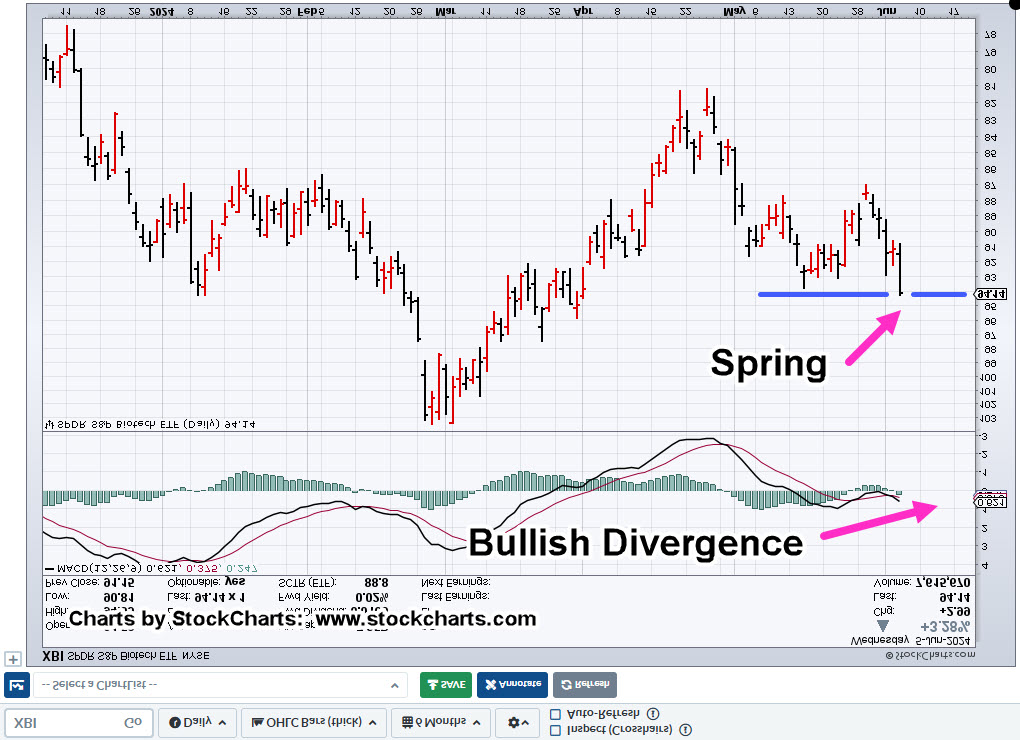
Potential for a bullish divergence, noted in the prior update.
Now, it’s here.
Obviously, the expectation is for price action to rise on the inverted chart(s); Downside for the actual XBI.
Fifth: Depending on what happens next, if we do get a reversal to the upside, inverted charts, there’s a potential for that action to be swift.
If and when that happens, we’ll cover it in another update.
Stay Tuned
Charts by StockCharts
Note: Posts on this site are for education purposes only. They provide one firm’s insight on the markets. Not investment advice. See additional disclaimer here.
The Danger Point®, trade mark: No. 6,505,279

Pingback: The Case For ‘Swift’ Downside: XBI « The Danger Point®
Pingback: Biotech ‘Put’ … +160%, Overnight « The Danger Point®