If The Correlation Remains Intact

As the chart shows, real estate and bonds (interest rates) have been well correlated for over three years.
There are times, when that correlation gets ‘spread’; one market goes one way, while the other market goes … well, the ‘other’ way.
That time appears to be now.
Long Bonds TLT & Real Estate IYR, Daily Close
Note how the ‘spread’ eventually gets closed.
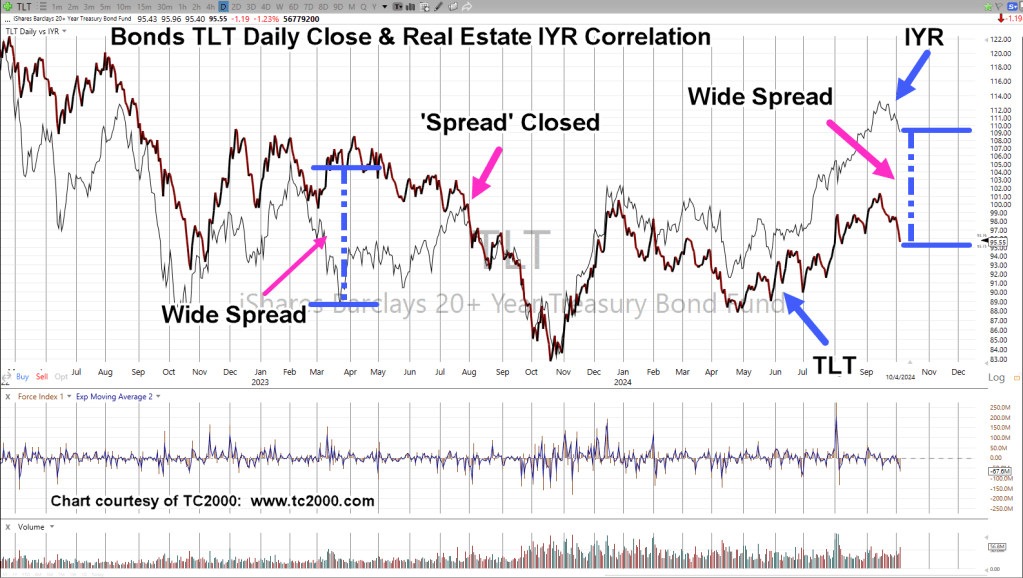
Note: The first spread on the left part of the chart took several months to close (completed in late July 2023).
The correlation remained near exact until about January 2024, where it began to diverge again.
Now, we’re spread with bonds heading lower (rates higher) helped along with the latest ‘jobs data‘.
Positioning
If time permits, we’ll go into price action posted yesterday and how this series of two IYR, price bars, yesterday, the day before, are (almost) exactly like DE (John Deere) price action shown by Daivd Weis on his video … except taking it from a short perspective.
Current position DRV-24-05, remains intact; stop now moved tentatively to the DRV session low for today (not advice, not a recommendation).
Stay Tuned
Charts by StockCharts
Note: Posts on this site are for education purposes only. They provide one firm’s insight on the markets. Not investment advice. See additional disclaimer here.
The Danger Point®, trade mark: No. 6,505,279

Pingback: Bonds … The October Surprise « The Danger Point®