Below Support, and Slipping

Does one downside gap, beget another?
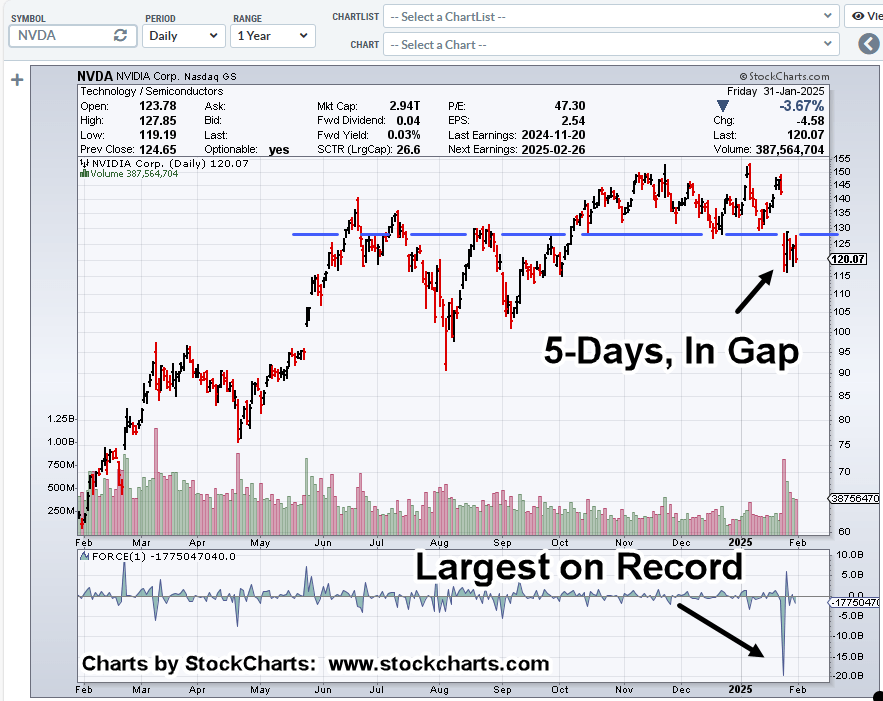
The gap-lower open Monday, January 27th, was only retraced by a Fibonacci 23.6%, the next day before continuing lower.
If that percentage holds, it’s a rare occurrence and represents extreme weakness (not advice, not a recommendation).
The chart for NVDA, shows we’ve had the largest down-thrust energy in history (NVDA began trading 1/22/99).
Now, it’s hanging below resistance (blue line).
Nvidia NVDA, Daily
Last Friday closed lower; after-hours, lower, still.
Strategy, Tactics, Focus
As the ‘About‘ section says, techniques on this site are laid out by three masters and coached, mentored, by one of, if not the best in the industry (the late David Weis).
With that said, everyone has their own style.
Currently short the sector via SOXS, as SOXS-25-04 (not advice, not a recommendation).
Stay Tuned
Charts by StockCharts
Note: Posts on this site are for education purposes only. They provide one firm’s insight on the markets. Not investment advice. See additional disclaimer here.
The Danger Point®, trade mark: No. 6,505,279
