Rates, Back on The Rise

Yesterday, was the reversal set-up for real estate (not advice, not a recommendation).
Now, it’s bonds
The bond chart below shows TLT, in a near-perfect trading channel.
Long Bonds TLT, Weekly
In addition to the channel, there’s a Fibonacci time correlation.
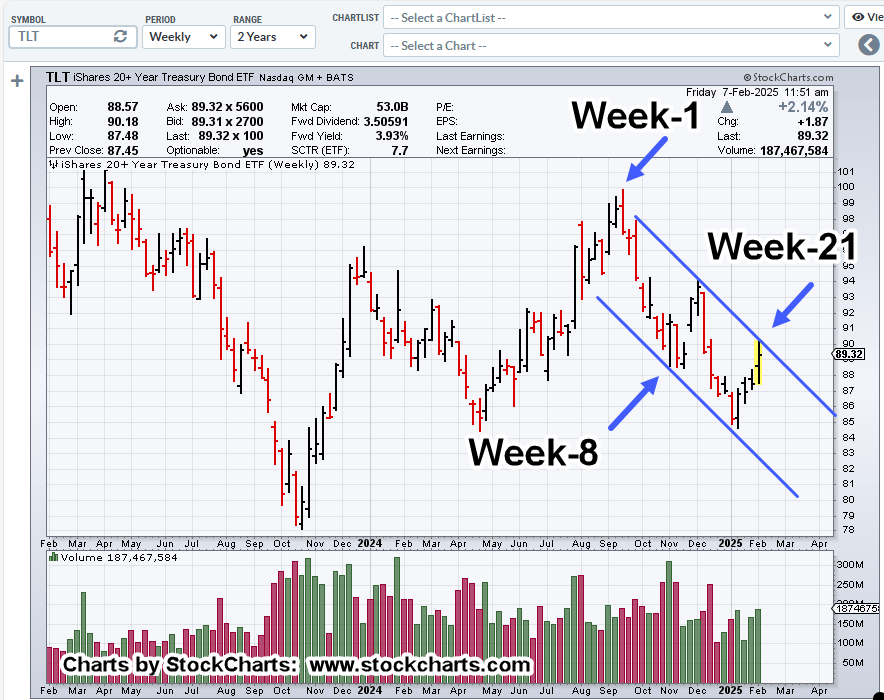
Or course, this could be the week (or next) where bonds break out to the upside.
Anything can happen.
For now, price action remains in the down-channel.
The next item shows we’re potentially at some kind of transition point.
Retail, ‘All-In’
Behind the scenes, reports like this, tell us the ‘retail investor’, i.e., the least informed and least disciplined participant is literally, ‘all-in’ the market.
What could go wrong?
Stay Tuned
Charts by StockCharts
Note: Posts on this site are for education purposes only. They provide one firm’s insight on the markets. Not investment advice. See additional disclaimer here.
The Danger Point®, trade mark: No. 6,505,279

Pingback: Big-Cap, ProLogis … Reversal « The Danger Point®