Modeling The Dot-Com

Nvidia looks like it’s rolling over.
There was an early morning ‘blip’ to the upside that was quickly retraced.
Known & Unknown
Some things are known.
We know Nvidia printed the largest-ever, downside thrust energy during the breakdown, January 27th.
Then came the process of retrace and test.
Also known (see chart) upside energy, i.e., Elder’s Force Index, at this point, has dissipated to almost nothing; suggesting the test is complete or near complete (not advice, not a recommendation).
Nvidia NVDA, Weekly
At this juncture (12:18 p.m., EST) Nvidia is just 0.16-pts away from a lower weekly close and reversal bar.
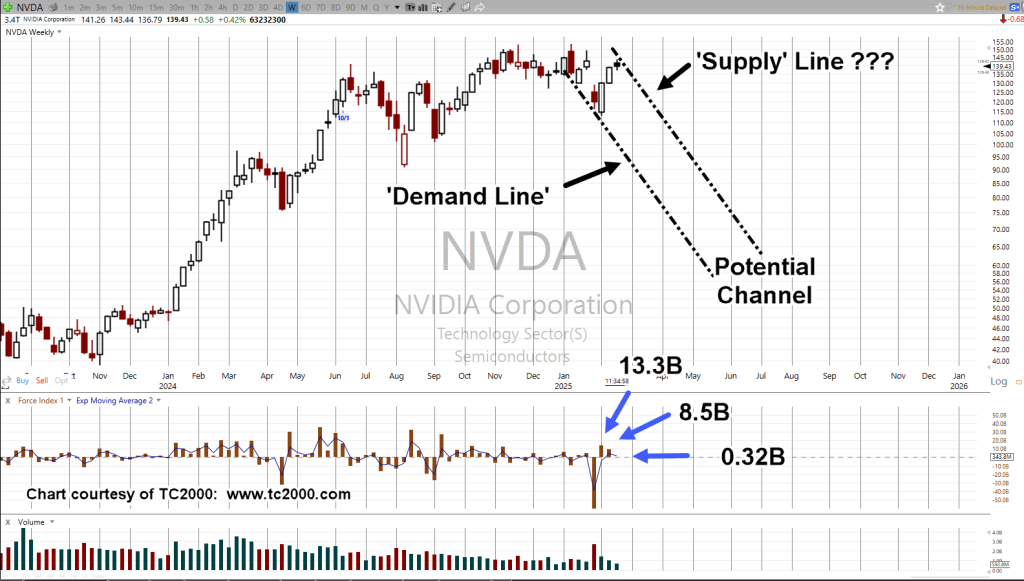
The ‘Supply’ line is of course unknown until there’s more confirmation.
Bubbles Past
If we’re in a bubble, then work has already been done (link here) on what to expect when price action has tested its last to the upside, then turns lower.
Stay Tuned
Charts by StockCharts
Note: Posts on this site are for education purposes only. They provide one firm’s insight on the markets. Not investment advice. See additional disclaimer here.
The Danger Point®, trade mark: No. 6,505,279
