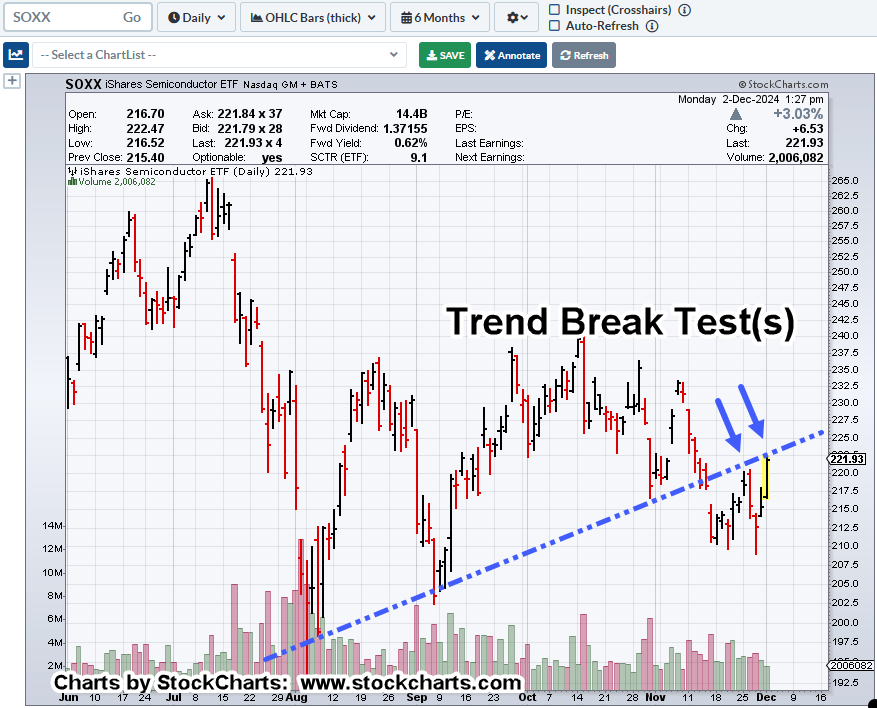
Adjusting The Trendline

Now, all-of-a-sudden, it’s a ‘thing’:
DeepSeek Breaks the AI Paradigm, link here.
YeaR OF THe SeeK…DeeP SeeK, link here.
The Competency Crash, link here.
DeepSeek AI App Demonstrates Pro-CCP Bias, Influence, link here.
The list is seemingly endless. Time for everybody to pile-on to the new narrative.
However, it does beg the question, Isn’t ‘The Thing‘ somewhere on I-10, in Arizona? 🙂
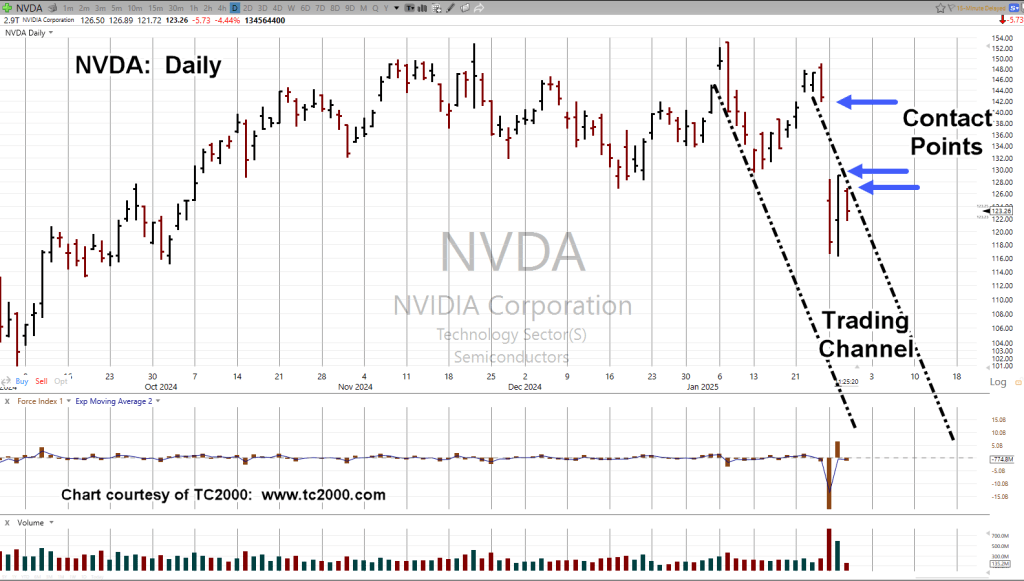
Getting back to reality, chief cook and bottle washer Nvidia, we’re going to adjust the trendline (just a bit) from yesterday’s update.
Nvidia NVDA, Daily
The objective is, maintain short, monitor the trend for potential break (and exit), wherever and whenever that may be (not advice, not a recommendation).
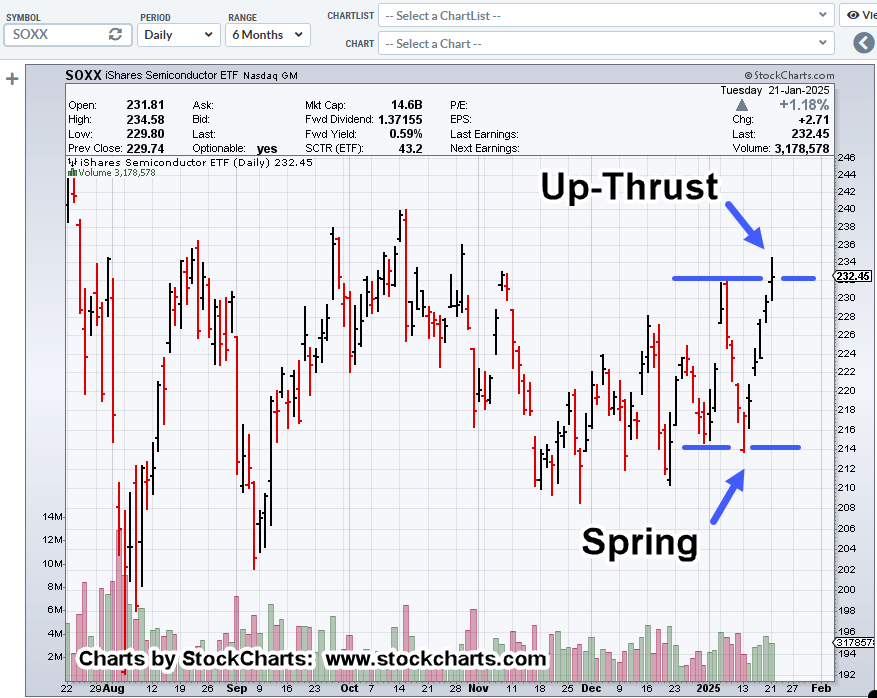
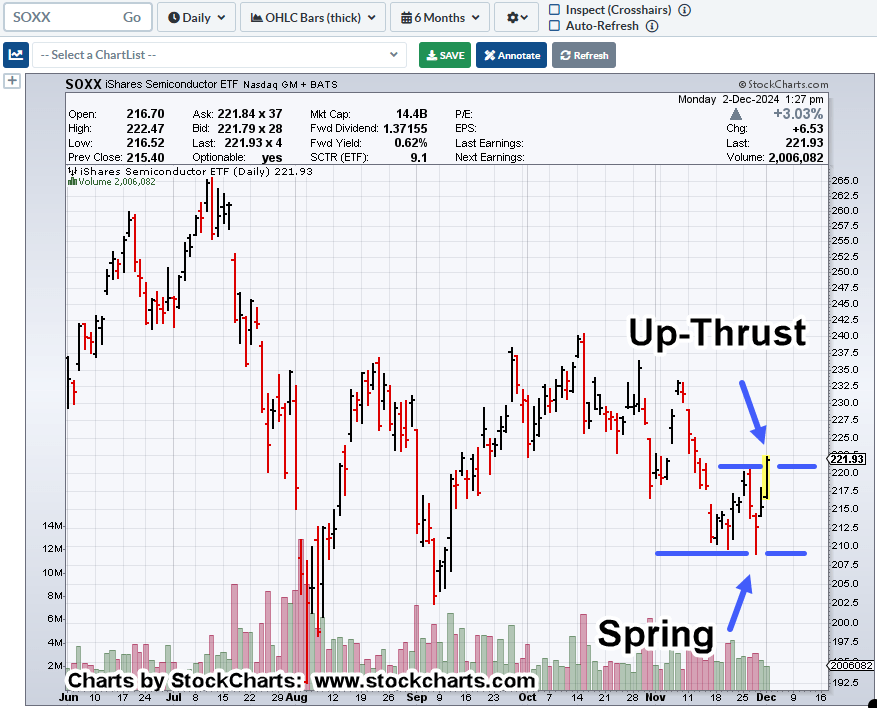
It’s important to note, yesterday’s action was Spring-to-Up-Thrust; penetration of the prior day’s low and high.
Then, The Fed
Also note, we have the Fed coming up with more shenanigans in about two hours (as of 12:03 p.m., EST).
Stay Tuned
Charts by StockCharts
Note: Posts on this site are for education purposes only. They provide one firm’s insight on the markets. Not investment advice. See additional disclaimer here.
The Danger Point®, trade mark: No. 6,505,279