Is the latest stimulus bill inflationary or deflationary?

For those adhering to the tenets of Wyckoff analysis (as this site does), you already know it’s sort of a trick question.
The answer is: It doesn’t matter.
Maybe a better way to put it, it’s the wrong question.
The right question is: What’s the market saying about itself?
The market itself will decide (or reveal) the next probable direction.
Before we get to the charts; remember, one objective for the (U.S.) markets and political kabuki theater is, destroy the middle class.
Exactly how that’s going to happen in the final act is unknown.
Perhaps it’ll be illegal to go to the bullion dealer (or the grocer) without proof of protection (injection). Problem solved.
That destruction remains the backdrop; the macro for the analysis.
Moving on to the charts:
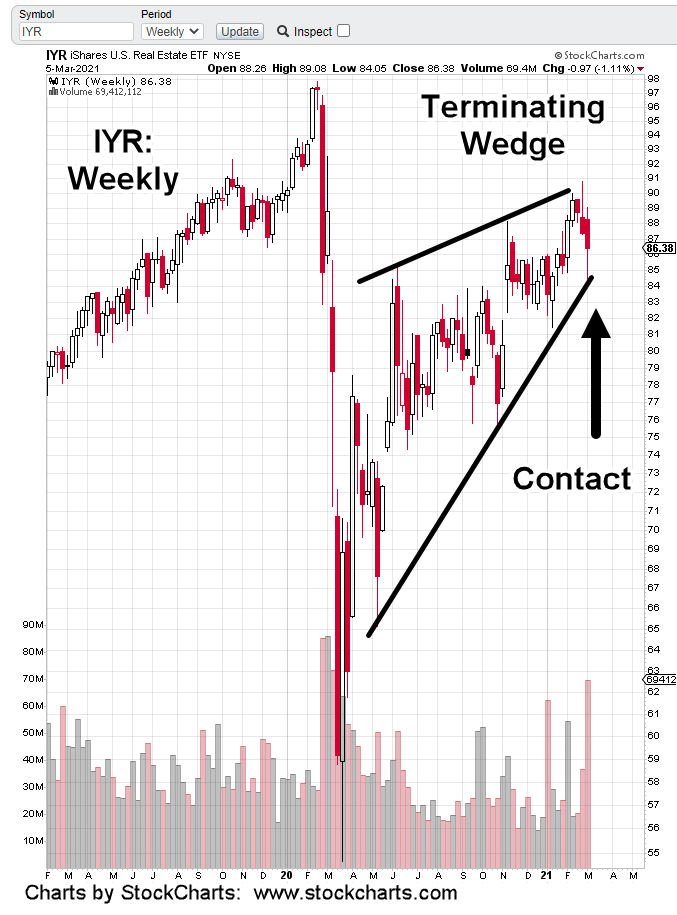
Real estate remains in a terminating wedge. Last week’s action had IYR contact the lower wedge boundary and then retrace into the close.
Weekly volume was the highest since the week of March 13th, 2020, almost exactly one year ago.
So, we see the ‘face ripping’ Friday rally, ‘plunge protection team‘ action, had no material effect on the chart’s technical message.
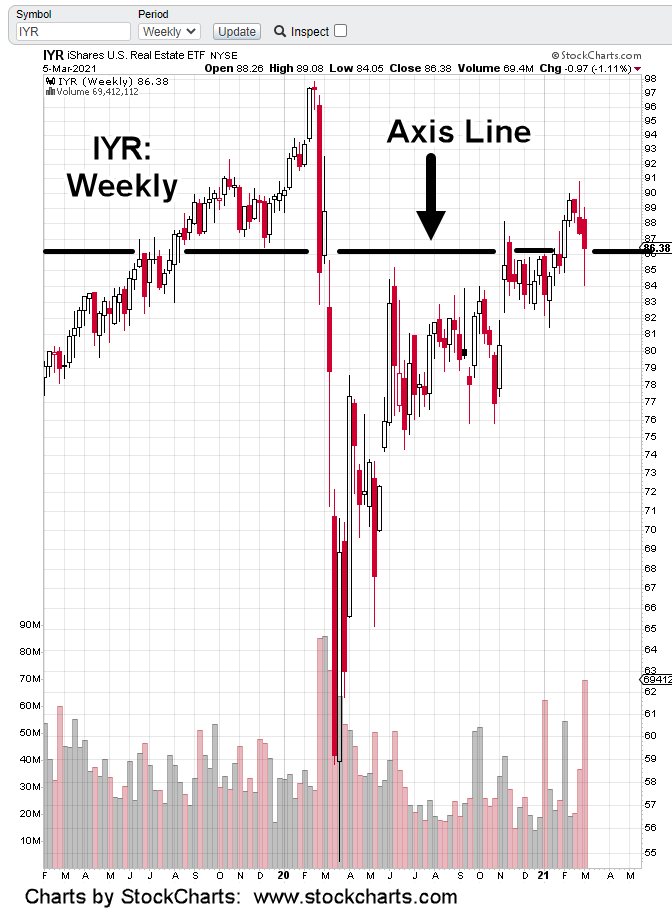
Looking at it a different way, there’s also an axis line in play.
Market oscillations about axis lines are completely normal.
We’ll see if Monday’s action is ‘buy the rumor, sell the news’. We’ve already had buy the rumor (stimulus) with Friday’s rally.
Stay Tuned
Charts by StockCharts

Pingback: American Tower, Leads Down « The Danger Point