12:32 p.m. EST
Time and technical have come together; indicating potential downside collapse in biotech.

Collapse potential is immense and has been for years.
Fibonacci 55 days after the 2/10/21, highs, biotech (SPBIO), pivots decisively lower.
Of all the major indices, biotech on a percentage basis, is the downside leader.
Rightly so.
Fundamentally, it’s poised to disintegrate with its illegal, Mengele style campaign of medical experimentation.
Who knows if that full disclosure will happen.
The ‘controllers’, the oligarchs, may come up with some other mechanism to usurp the media, the internet and keep it all under wraps.
However, it looks like the tide’s turning.
Remember, the market leads the news; not the other way around.
If biotech goes into its well deserved collapse, downside action itself will be the catalyst for exposure.
For now, SPBIO is pivoting lower; LABD higher.
The daily chart of LABD shows the Fibonacci time relationship. From low to low; Fibonacci 55 days.
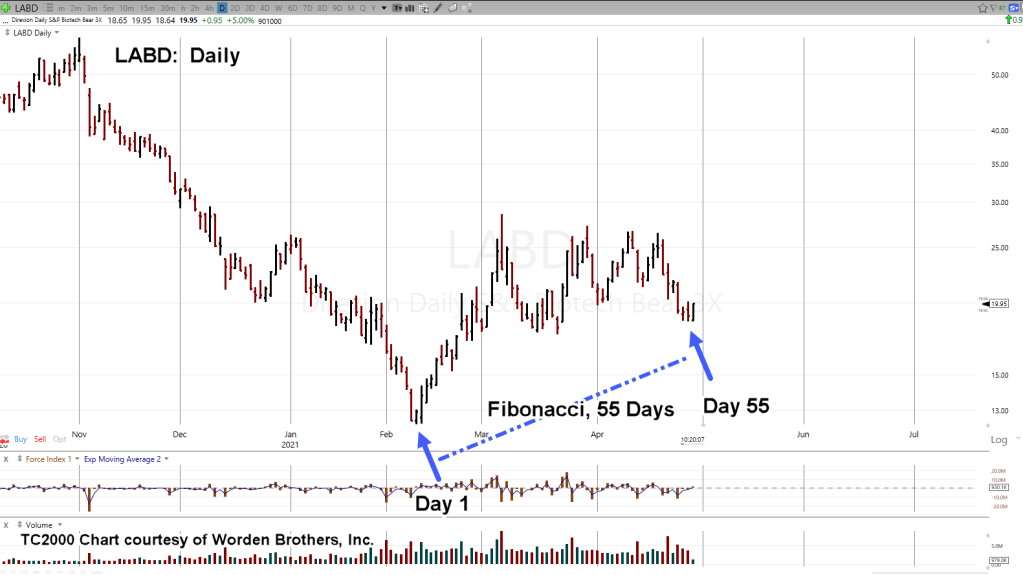
Yesterday, the 28th, was Day 55.
Today, LABD has already posted a new daily high … weighting probability to more upside (SPBIO, lower).
The next chart has the potential trading channel.
It looks aggressive.
However, the market itself has defined the trend.
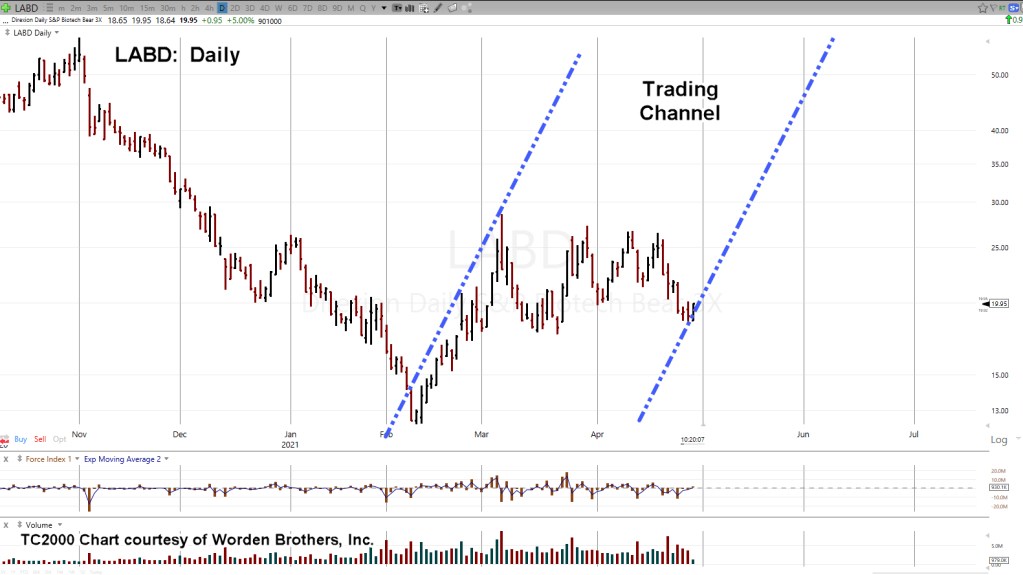
Shown, in pervious updates, this trend angle has been repeated at least four times from March 5th, LABD high, to yesterday’s low.
It’s no guarantee. We’ll let subsequent price action confirm or negate the right side trend.
As of this post, LABD continues to push aggressively higher.
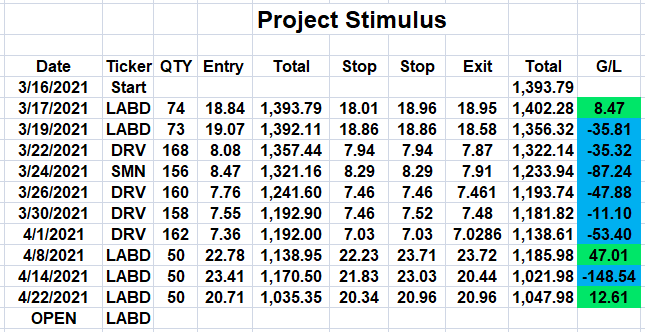
Our ‘project’ has an open position in LABD.
Without revealing specifics of that position (discussed previously), it’s represented in the table below:
Note: Posts on this site are for education purposes only. They provide one firm’s insight on the markets. Not investment advice. See additional disclaimer here.

Pingback: You Are Here « The Danger Point
Pingback: Access Denied « The Danger Point