12:57 p.m., EST
‘Breakout or Set-Up’ has been resolved
Biotech IBB, posts new daily low.

Going back a few days, we had the chart above:
Price action then stalled, retraced, penetrated support (blue line).
Yesterday, it edged higher in a low-volume test. Today, it reversed again and has just now, posted a new daily low.
It’s high probability the set-up is complete:
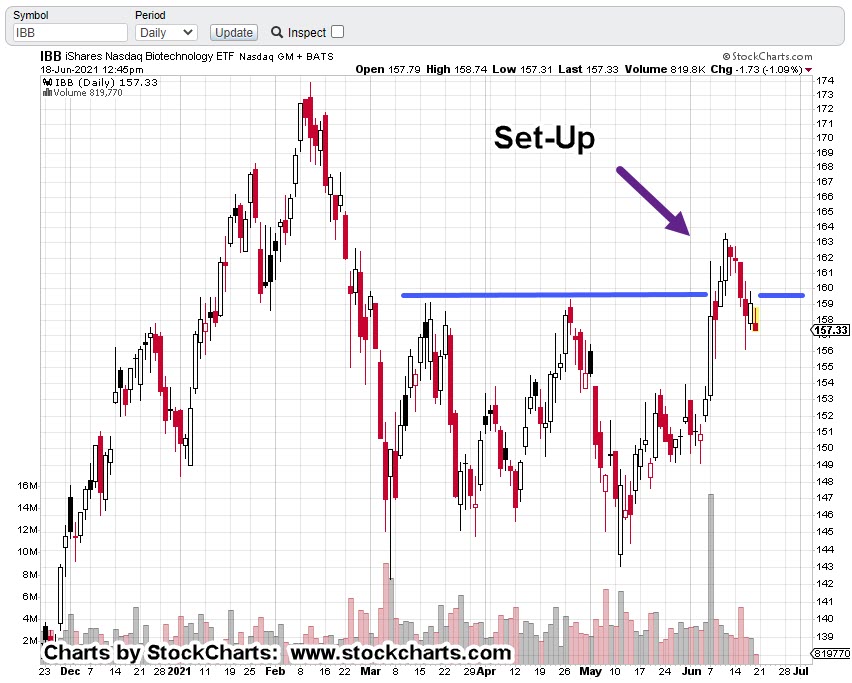
The expectation is for biotech IBB (and SPBIO) to decline from here.
Measured move targets have already been discussed as well as Point & Figure targets.
Several times in these updates the word ‘collapse’ has been used to describe the potential for biotech.
The monthly chart below shows a Fibonacci projection based off current price action.
Note how projected levels match up with support and resistance areas:

Obvioulsy, this is a long term projection.
It may work out the short position in biotech via LABD, (not advice not a recommendation) will have to be exited and re-entered several or many times if/when the sector heads for the bottom.
Stay Tuned
Bonus:
The hourly chart of IBB below, shows Wednesday’s price action touching, then bouncing off the first Fibonacci projection.

Charts by StockCharts
Note: Posts on this site are for education purposes only. They provide one firm’s insight on the markets. Not investment advice. See additional disclaimer here.
