Before The Open
Looking At The 3-Day GDX, Chart

As Dr. Elder once said (paraphrasing): ‘There are many ways to make money in the markets … even more ways to lose it.’
The time required to master the basics like support, resistance, accumulation, distribution is up to the individual.
After that however, the experimentation starts: Fibonacci retrace, time sequences, technical forces, multiple time frames and on.
Experimenting with the chart of Senior Gold Miners GDX, shows at this time, a 3-Day chart reveals nuances not seen (so easily) in the daily or weekly.

We’re going to invert the chart to mimic the GDX inverse fund DUST (without the tracking errors) as shown below:

Then comes the mark-up:
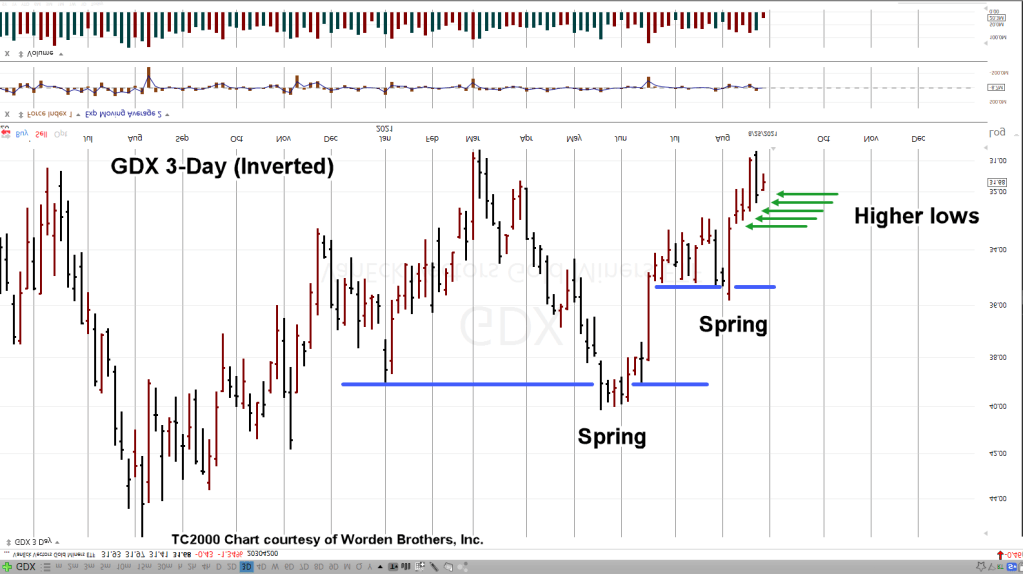
All of a sudden, it becomes clear. Inverted GDX has been in a series of springs (up-thrust, non-inverted) and is now pivoting to the upside. That pivot is shown with the green arrows.
Each 3-Day period having a higher low than before.
As detailed in this prior update, GDX is potentially on the verge of ‘free fall’ (not advice, not a recommendation).
Pre-market trading has GDX, lower with DUST higher.
Stay Tuned

Pingback: GDX Update « The Danger Point®