Fibonacci Channel
Is there more pain ahead for the gold bulls?
Short answer: Yes
That is, unless the current patterns in price action change.
From a professional trader’s standpoint, one has to be on-watch for two things:
First:
Be mentally flexible enough to recognize the trade is falling apart and then exit.
Second:
As Prechter put it years ago, be mentally prepared to accept the huge gain.
At this juncture, what is the chart of GDX, telling us?
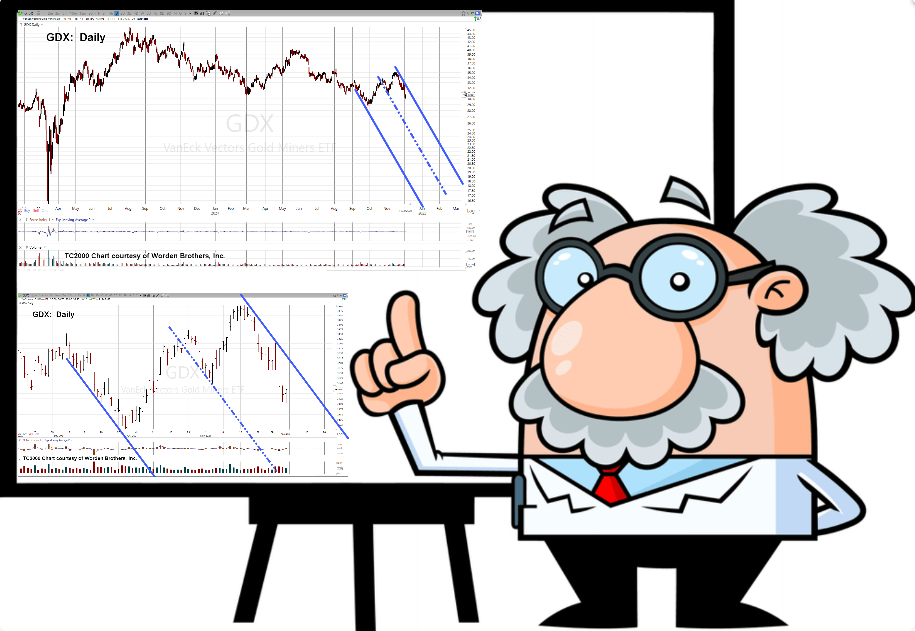
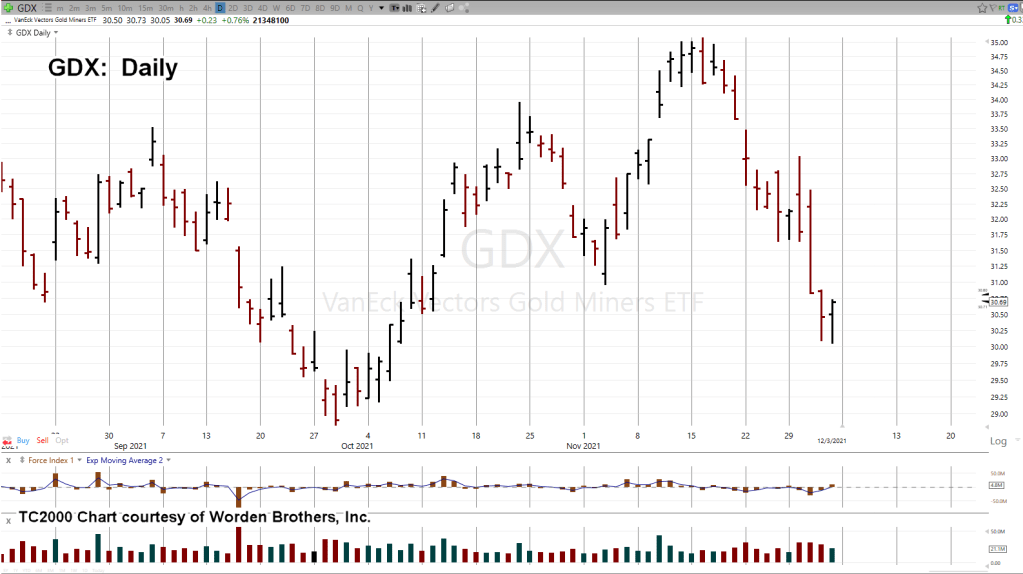
Senior Miners (GDX), Daily
The un-marked chart.
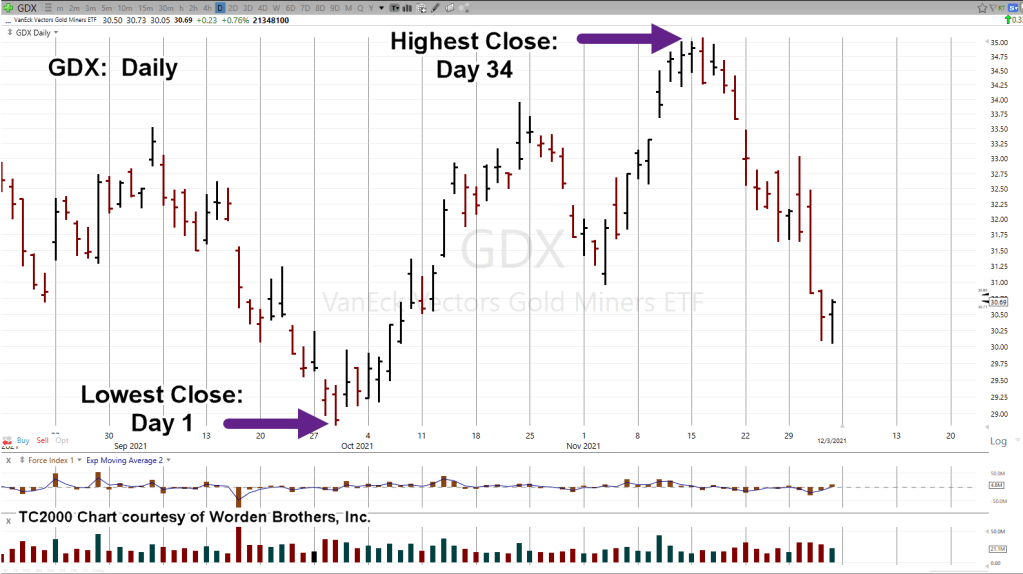
Marking-up with Fibonacci time sequence.
Adding-in some trend lines.
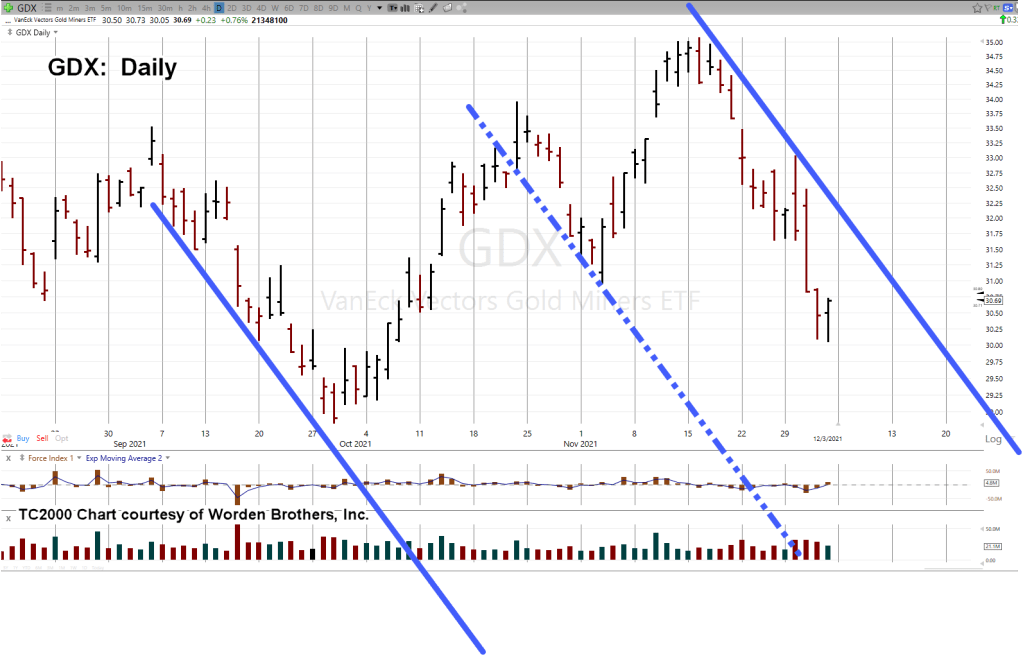
Zoom out to show the big picture.
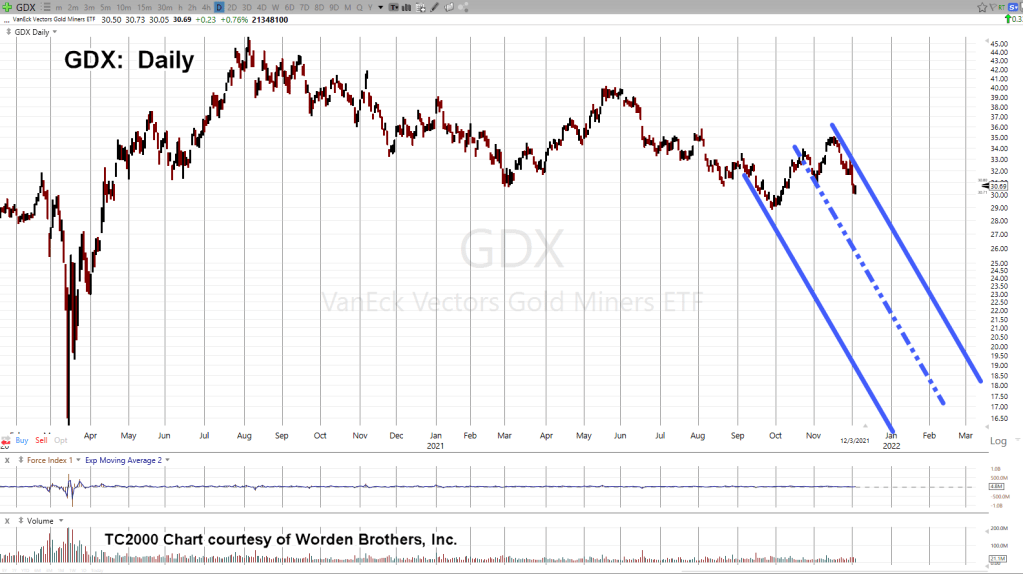
Summary:
From low-close, to high-close, the counter trend move took a Fibonacci 34-days.
In the process, it appears that price action is now moving within a trading channel.
In addition, the counter-trend print high on 11/16/21, was close to a 38%, retrace level (not shown) of the entire move from the peak on 8/5/20, to the 9/29/21 low.
Positioning
The last update detailed how a short position was opened in the miners (not advice, not a recommendation).
At this juncture, price action continues to indicate lower prices ahead.
The short is being maintained.
Stay Tuned
Note: Posts on this site are for education purposes only. They provide one firm’s insight on the markets. Not investment advice. See additional disclaimer here.
The Danger Point®, trade mark: No. 6,505,279
