Time To Decide

In the markets, sometimes a decision is quick. Sometimes, it takes days or longer.
Back in mid-November, it took eight days above resistance before the market decided enough gold bulls had been trapped; then headed lower.
As we’ll see below, we’re at another decision point.
Newmont (NEM) Daily Close
The un-marked chart gives the impression that Newmont’s headed higher. It even looks like there’s been a test of its breakout above the 58.00 area.

Let’s start marking-up this chart Wyckoff style to see what’s really happening.
For sure, price action has pushed above the 58.00-level.
In so doing, its gone from ‘Spring to Up-thrust’; a potentially bearish (reversal) set-up.
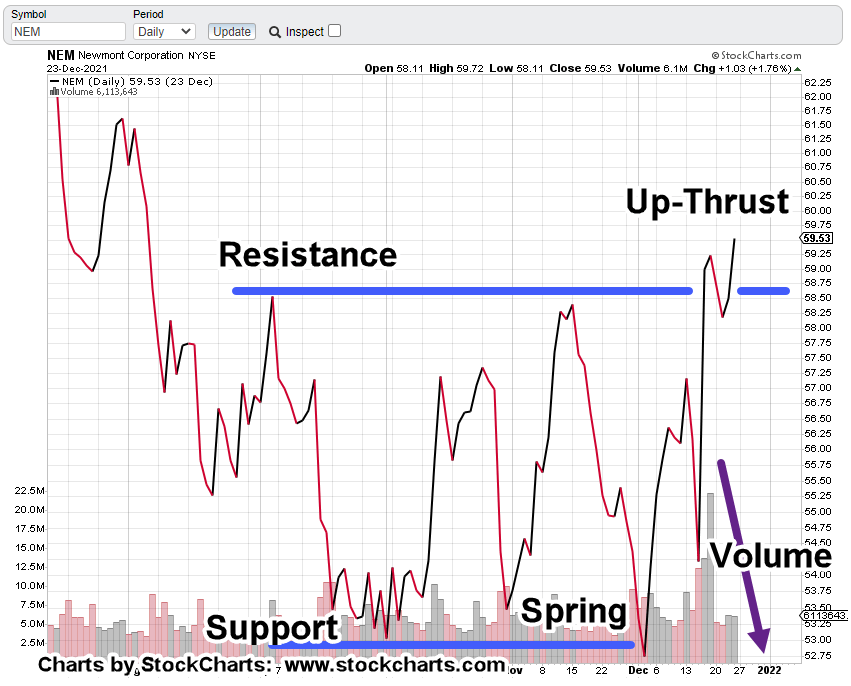
Adding to a bearish view, volume has declined significantly.
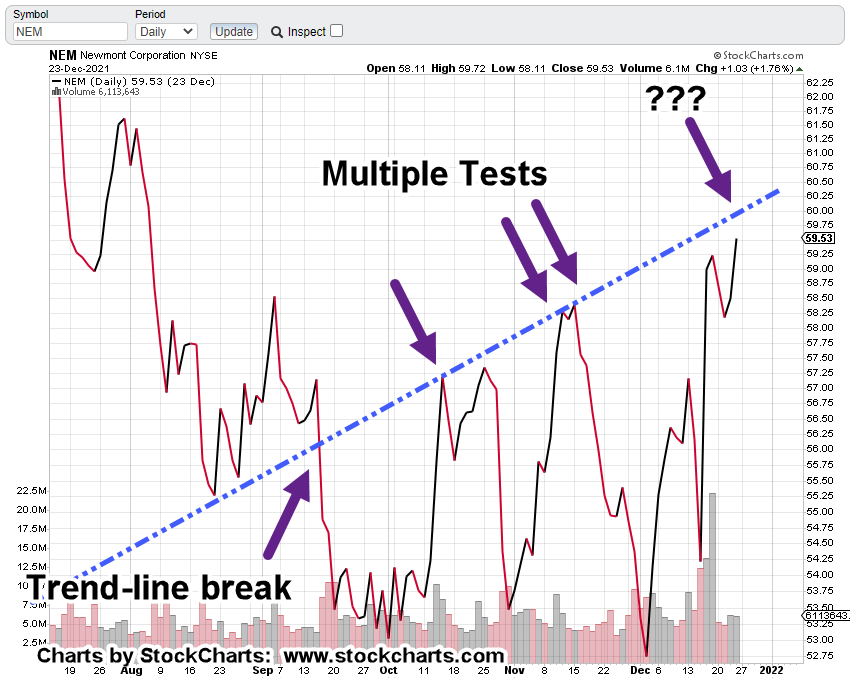
However, that’s not all. We’ve got some kind of trendline break with multiple tests as well.
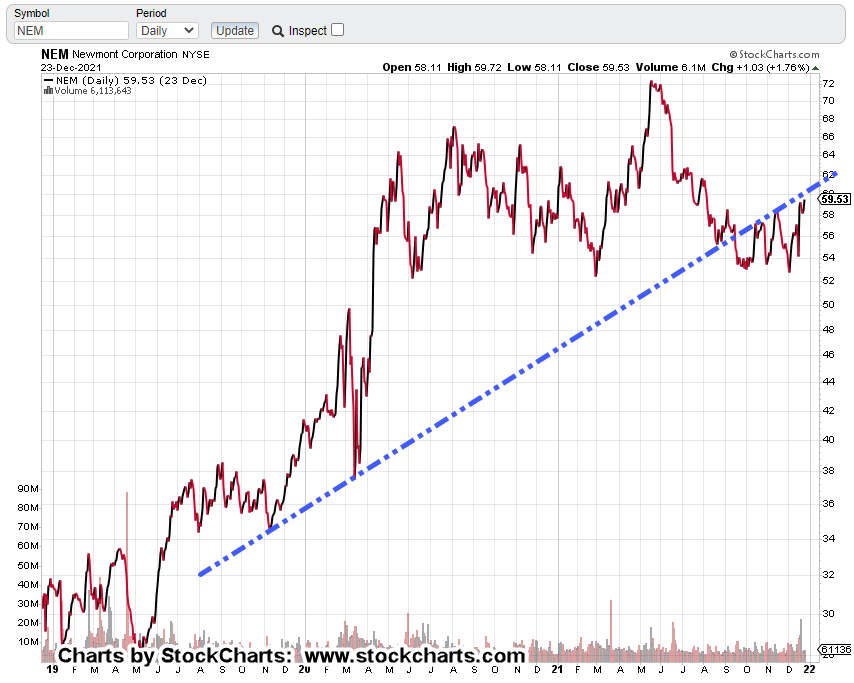
Pulling farther out, we see that trendline has been around for some time.
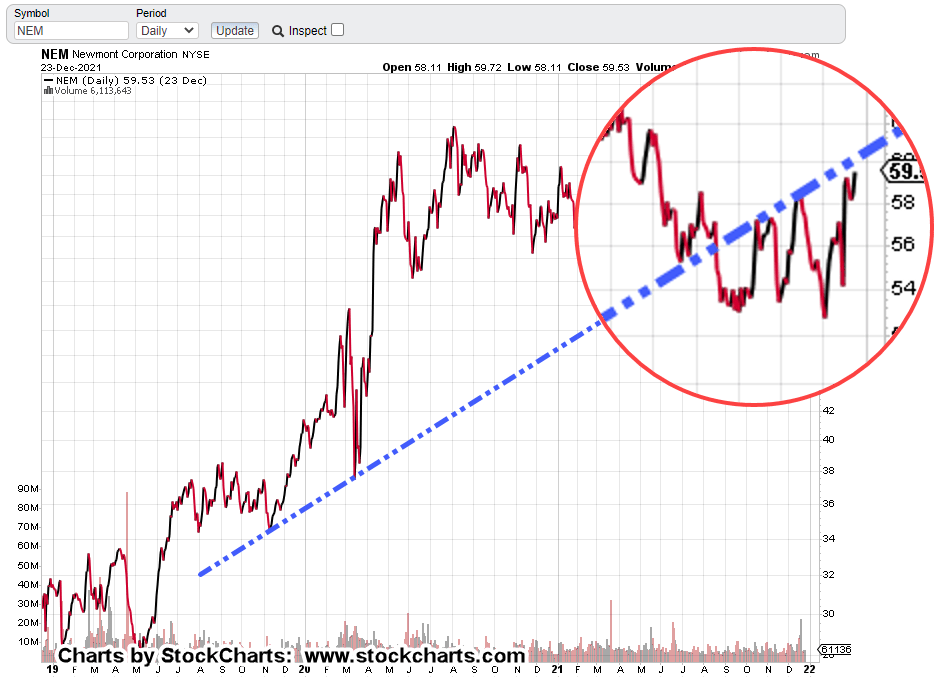
Getting closer-in on that longer term chart shows the congestion of testing action.
Summary:
Newmont’s got itself into an up-thrust (potential reversal) while testing the underside trendline.
That trendline goes all the way back to late 2019.
Out of thirty-one (31) equities in the GDX, only Newmont’s at its mid-November highs.
All others are lower.
This market’s thinning-out.
Unless the dynamic changes, money is exiting the lower cap equities completely and/or, being pumped into Newmont; a classic bearish harbinger.
Obviously, this can go on for a while.
However, Newmont’s already at the crossroads; Underside test and up-thrust.
Stay Tuned
Charts by StockCharts
Note: Posts on this site are for education purposes only. They provide one firm’s insight on the markets. Not investment advice. See additional disclaimer here.
The Danger Point®, trade mark: No. 6,505,279
