Wedge Break Has Been Tested

It’s been a while since we’ve talked about the chief cook and bottle washer in this whole financial collapse scenario.
However, biotech has not been forgotten.
There are two indices (ETFs) being tracked: IBB and SPBIO.
Both entered bear market territory long ago. SPBIO topped out, way back in February 2021; IBB topped later, in August the same year.
Leveraged inverse funds are LABD, and BIS, respectively. LABD is 3X inverse with BIS a 2X inverse.
The Long Term
One thing unique to David Wies, was to look at the long term: Monthly, Quarterly and Yearly charts.
Doing so, puts one in a strategic mindset … not easily swayed by the latest prattle from media sources.
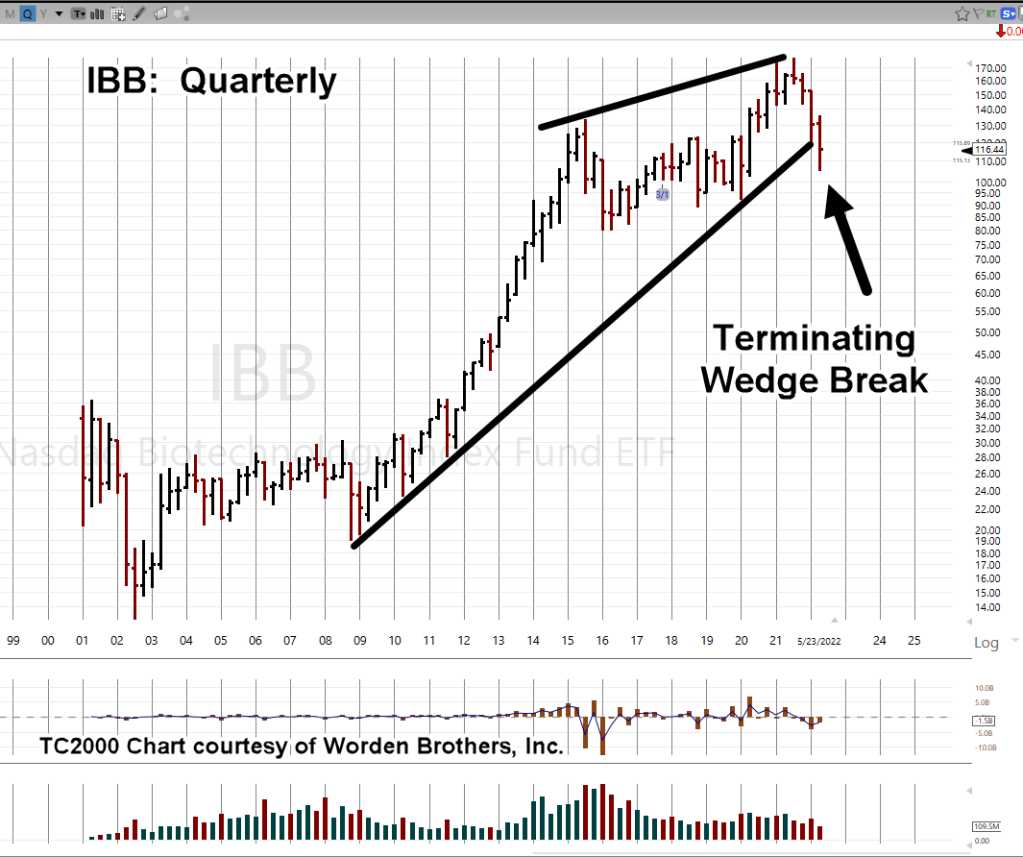
If we look at biotech, IBB, on a quarterly basis we have the following chart.
Biotech IBB, Quarterly

The mark-up of this chart is where it gets interesting.

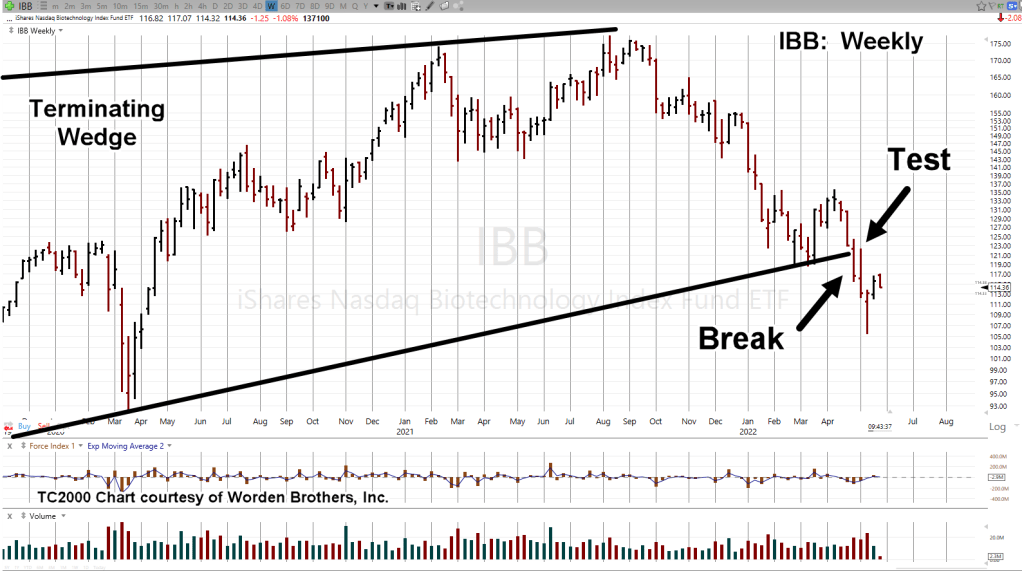
A terminating wedge that’s been over seven years in the making has just broken to the downside.
Not only that, when we get closer-in (on the weekly), we can see the wedge break has been tested and now today, appears to be reversing to the downside (shown on daily).
Biotech IBB, Weekly

With zoom

The daily shows a Fibonacci retrace to 38%; then today, a downside reversal.

You can see where this is going.
Based on the above analysis a short position in IBB, has been opened via BIS (not advice, not a recommendation).
The trade is BIS-22-01, with an (initial) entry @ 28.5173
Summary
The news on specific biotech companies is already out if one knows where to look.
Stated time and again on this site, we’re just in the beginning stages of the repercussions.
It even looks like they’ve moved on from the initial scam and are cooking up a new one.
Stay Tuned
Charts by StockCharts
Note: Posts on this site are for education purposes only. They provide one firm’s insight on the markets. Not investment advice. See additional disclaimer here.
The Danger Point®, trade mark: No. 6,505,279
Pingback: ‘Investors’ Buy Dip Over & Over « The Danger Point®