What If Europe Abandons ‘Green Energy?’

The ‘Texas Freeze‘ laid bare the farce that is ‘renewable’ energy.
Will this coming winter do the same for Europe?
Like a limpet on an ocean liner, the ‘silver squeeze’ idea won’t go away.
Here we have yet another report; linked here.
The data in the report’s not in dispute. If that data is to be believed (no reason not to), silver stockpiles are shrinking.
Even so, the major trend-change (down) in silver was identified way back in February of 2021; reports are linked here and here.
The second report stated silver had ‘changed hands’ from strong to weak.
It’s been nearly 20 months since then; silver remains below that February 1st, 2021, level and is down -35.7%, as of Friday’s close.
I like silver as much as the next guy but what we’re discussing here, is strategy.
Silver To Single Digits?
Is that even possible?
Well, was oil going negative possible?
Not until it happened.
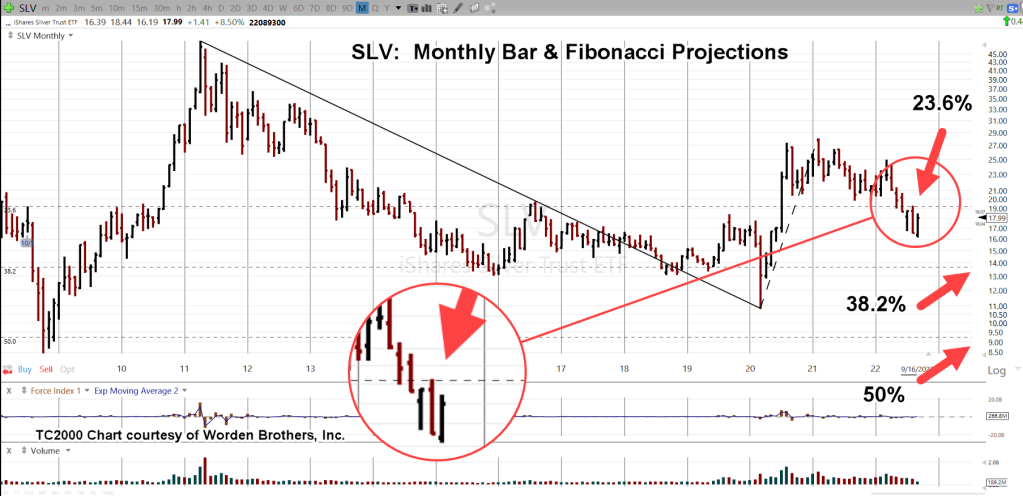
The monthly chart of SLV below, has a standard Fibonacci projection shown. Note how at 23.6%, the projection shows price action tapped and reversed down.
Next up is 38.2% at around 13.75, and then 50%, below the 10-area.
Silver SLV, Monthly Chart

Zoom version
And then, a trading channel.

Both silver and gold, are at The Danger Point.
Gold has pushed below support and is currently in Wyckoff spring position.
Silver is below the 20-area, which is established support.
If a rally is in the cards, this is the place to start.
A failure to move decisively higher at this point signals the potential for much lower prices ahead.
Summary
The next update will discuss various tactics that could be used if/when there’s a major downdraft.
Stay Tuned
Charts by StockCharts
Note: Posts on this site are for education purposes only. They provide one firm’s insight on the markets. Not investment advice. See additional disclaimer here.
The Danger Point®, trade mark: No. 6,505,279

Pingback: Trading A Silver Collapse « The Danger Point®