Posts, Next Session

The next session will be a Fibonacci 21 days, from the IYR, intermediate high, printed on December 1st.
From that high, price action has declined, then bottomed, and is now in a retrace.
That retrace/test may have competed today with a weak attempt at new daily highs or we could see something more definitive tomorrow.
From a data release (i.e., ‘catalyst’) standpoint, the Chicago PMI, is scheduled for 9:45 a.m., EST.
Let’s go to the daily chart of IYR.
Real Estate IYR, Daily
The intermediate high is marked, and we see price action decline and now testing resistance underside.

If we go further down to the hourly chart … that’s where it gets interesting.
Real Estate IYR, Hourly
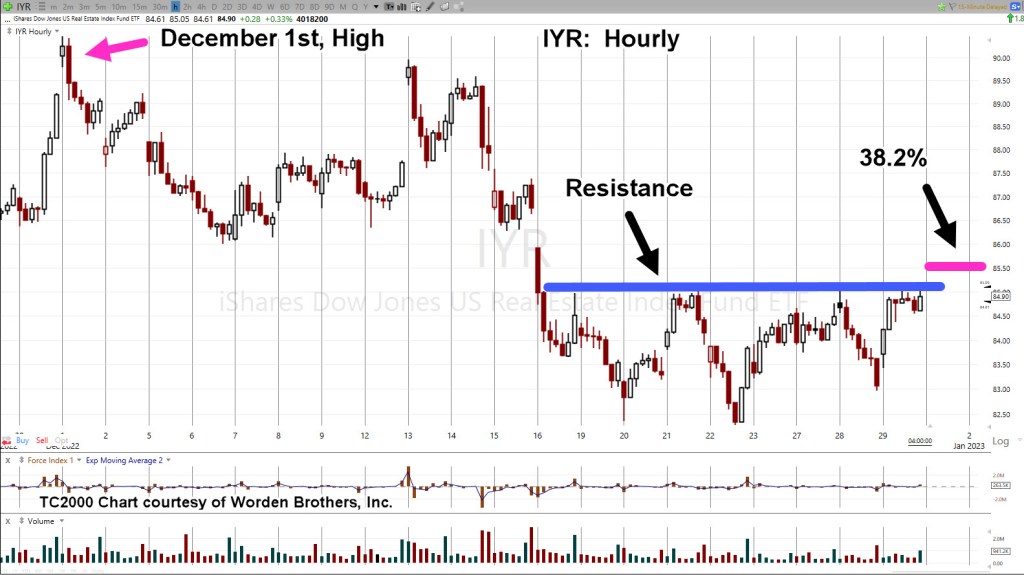
It’s clear we have a well-defined resistance that’s just below a 38.2%, retrace level.
Obviously, a push above this level and then reversal, is the definition of a Wyckoff ‘up-thrust’.
Summary
Fibonacci timeframes are somewhat approximate. If everybody’s waiting for it, it’s not likely to happen.
That’s why some Fibonacci reversal dates are either a day early or a day late … just to keep everyone guessing.
With that in mind, the test may have completed today, or it could tomorrow (Day 21), or the first trading day of 2023.
In an ideal scenario, we get a blip higher (above resistance) at the open tomorrow that’s quickly retraced (not advice, not a recommendation).
Stay Tuned
Charts by StockCharts
Note: Posts on this site are for education purposes only. They provide one firm’s insight on the markets. Not investment advice. See additional disclaimer here.
The Danger Point®, trade mark: No. 6,505,279

Pingback: Asset Confiscation, Gaining Speed « The Danger Point®
Pingback: The 15-minute, ‘January Effect’ « The Danger Point®