Higher Taxes, Starting Today

But wait, it’s not just taxes.
According to this link, it’s not only higher taxes, but retirement accounts being hi-jacked through rule changes.
‘The bulk of the wealth of the American people.’
Not to be outdone, the IRS will increase penalties for under and overpayment of taxes as reported by Fox Business via Jerimiah Babe (time stamp 22:16).
At least it’s nice to know, implementation of the ‘$600’ rule will be saved until next year. 🙂
So, we have the context for the year 2023; i.e., wealth destruction, asset confiscation, fines and fees.
It’s a straightforward plan on ‘their’ part.
What’s also straightforward as reported by Babe, a large number of Americans don’t even know what’s going on let alone be willing to take action.
Then, The Elephant
Let’s not forget the ‘elephant’ that’s likely to be the biggest driver for 2023.
We see that elephant every day now and sometimes multiple times a day. It’s starting to reach the fringes of the mainstream with articles like this one.
Scroll down to The List … It’s No. 2
That elephant and its subsequent lack of demand (less population, fewer buyers) as a result, will likely affect real estate in a big way … for decades to come (not advice, not a recommendation).
The last update showed the weekly trading channels in IYR. The next chart goes further out to the monthly and identifies a Fibonacci sequence.
Real Estate IYR, Monthly
So far, we’ve had IYR on the daily (link here), the weekly (link here), and now the monthly, below.

Major inflection points on the monthly have occurred at Fibonacci timeframes.
Original Forecast, October
The analysis of the current set-up started way back in late October. Using a weekly chart, a potential Fibonacci sequence was identified that ultimately proved correct.
Real estate IYR, had its print high during Fibonacci Week 8, as shown below in the original forecast.
The next chart shows where we are now, again on the weekly timeframe.
Real Estate IYR, Weekly
Original Analysis & Forecast
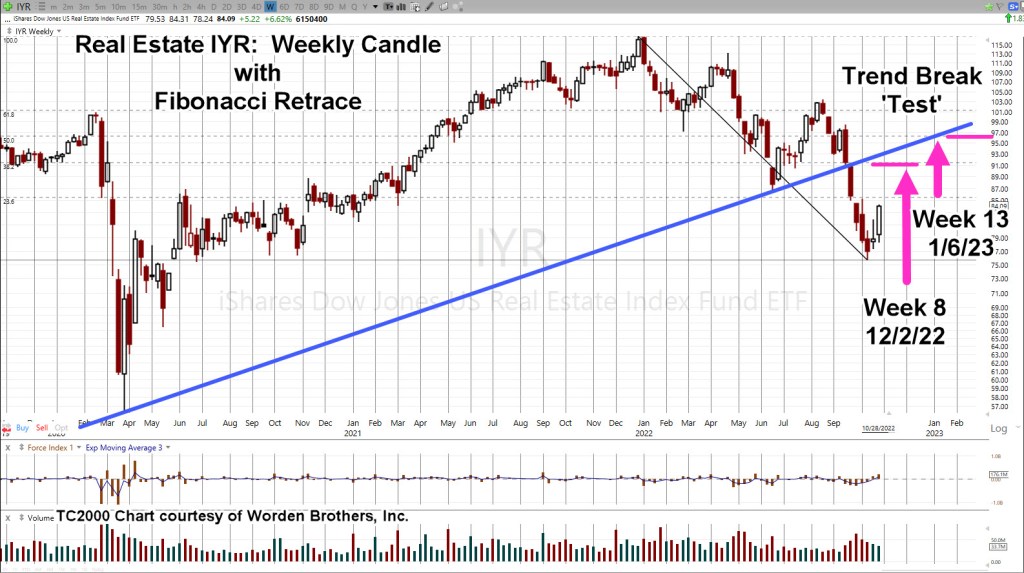
The updated chart shows the subsequent price action.

Real estate IYR, has pivoted lower and posted tight price action over the past two weeks. Tight action typically precedes a breakout or directional move.
Summary
Anything can happen in the markets.
Even though a good analysis has been presented to indicate further downside for IYR, this Tuesday’s action will let us know for sure.
Typical vehicles to go short the sector are leveraged inverse funds DRV (-3X) and SRS (-2X) or to short the IYR directly (not advice, not a recommendation).
Stay Tuned
Charts by StockCharts
Note: Posts on this site are for education purposes only. They provide one firm’s insight on the markets. Not investment advice. See additional disclaimer here.
The Danger Point®, trade mark: No. 6,505,279

Pingback: The 15-minute, ‘January Effect’ « The Danger Point®