… At Least, In Texas

Storage facilities in Texas are paying to have someone take excess Nat-gas.
As this link says, the ‘reason’ for negative Nat-gas, is high oil prices prompt drillers to increase oil production, along with (by-product) Nat-gas, driving down the price.
We’ll cover Nat-gas (UNG) in a separate update which by the way, on Friday, posted another Wyckoff spring set-up.
The question du jour is, ‘does oil go higher from here?‘
If oil is going higher (or likely to go), then Nat-gas may be pressured downward for longer.
International Chaos
The amount of ‘pontificating’ from the media on what oil is, or is not going to do, is mind-numbing.
Wyckoff himself said, we’re attempting to find out ‘the next probable direction’ for the market, which of course, can never be known for sure.
With that, let’s go to the truth of the matter, the chart.
Oil Tracking Fund, USO, Weekly
Shown on the chart, is a Fibonacci projection from the lows of March 2023, to the first wave high of April ’23, then back down to the wave low, in May ’23.
It might be hard to see, so the first waves are highlighted with green dashed lines.
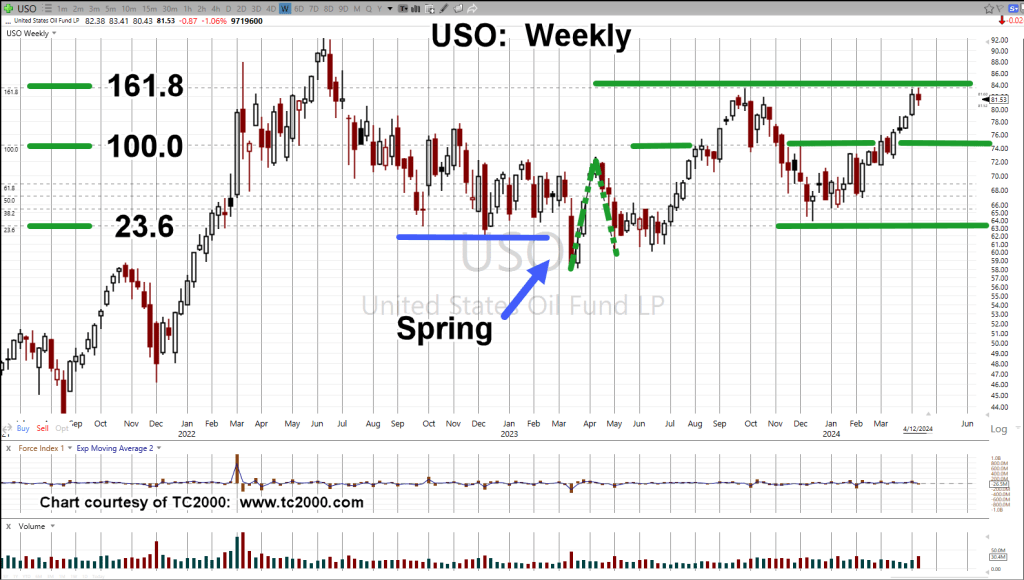
At this point, instead of asking the question ‘where’s oil going?’, a better question may be, ‘is the chart of USO “respecting” the Fibonacci projections?’
Looking at the chart, it’s an obvious, yes.
Right now, we’re at the 161.8%, projection and USO is hesitating; at the same time, Nat-gas, UNG, appears to be forming a long-term bottom (not advice, not a recommendation).
Stay Tuned
Charts by StockCharts
Note: Posts on this site are for education purposes only. They provide one firm’s insight on the markets. Not investment advice. See additional disclaimer here.
The Danger Point®, trade mark: No. 6,505,279

Pingback: ‘… Bullish Positions’ … Oil Futures « The Danger Point®
Pingback: Biotech Breakdown … Is This It? « The Danger Point®
Pingback: Oil Backs Off … Nat-Gas Bottoms « The Danger Point®