Hundred-Year Extremes
Going all the way back, this link, shows we’ve gone beyond 1929 levels.
It seems, nearly every recession (depression) gets kicked off with a spike in oil prices.
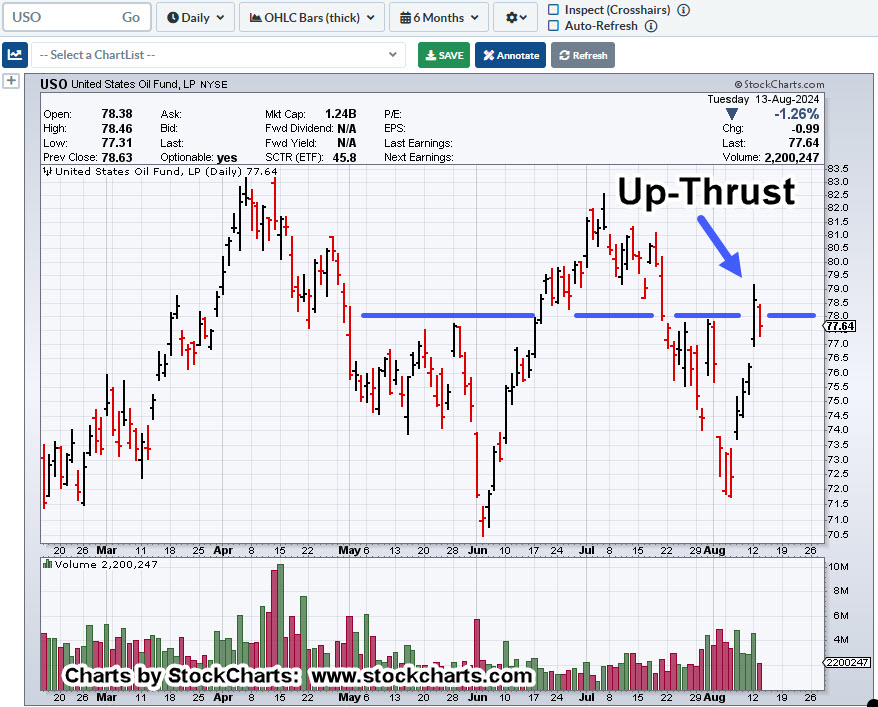
In 2008, USO peaked during the week of July 11, that year.
However, the damage was done.
The S&P (SPY) was already in decline, having peaked the week of October 12th, a year earlier.
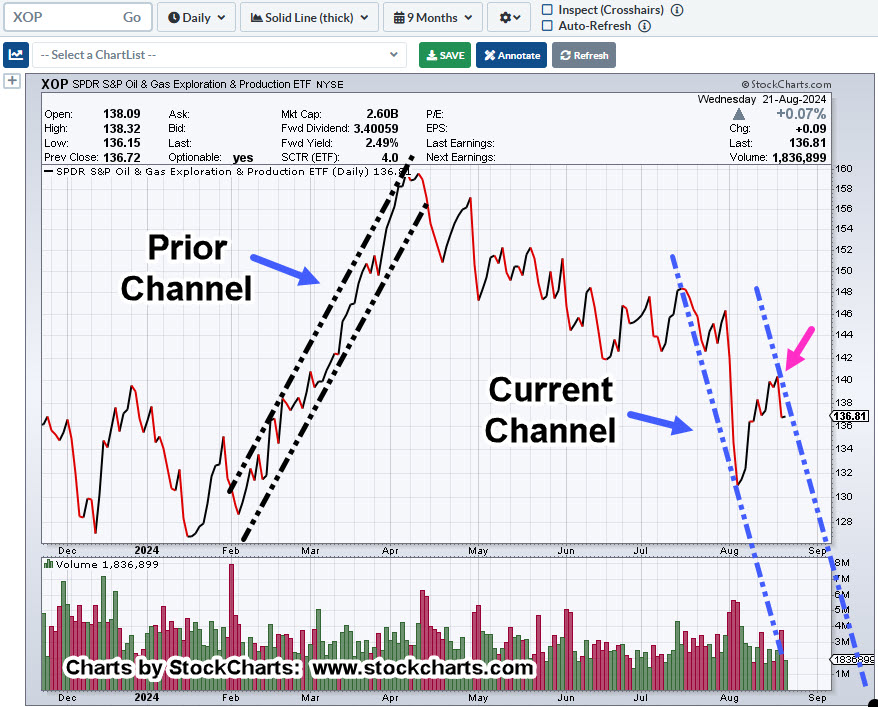
Another Extreme
Not to be outdone with the valuation extreme, we have the mutual fund cash extreme at this link.
Mutual fund managers are ‘all-in’, Time Stamp 4:15 (not advice, not a recommendation).
Then, there’s ‘private credit’, link here.
Now, on to the trade du jour.
Corning GLW, Weekly
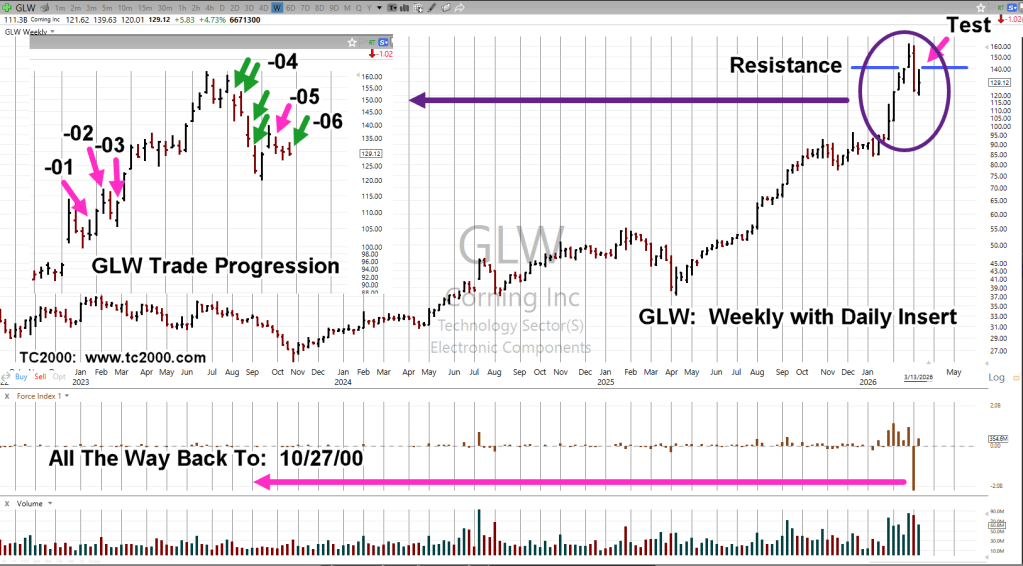
As GLW, was breaking out from generational highs, three attempts were made to short; result, small losses.
Adjusting Behavior
The most important take-away, is the behavior change as a result of losing entries; that is, stand-aside.
As said many times on this site:
“There’s nothing wrong with being wrong. It’s being wrong and staying wrong that’s the problem”
Once the Fibonacci sequence was identified, link here, short positioning continued.
Next Steps
Anything can happen.
For the chart above, the stop on the -06, trade is last Friday’s high (not advice, not a recommendation).
With that high as minor resistance, there’s also the weekly high at 139.63, for additional ‘protection’.
Stay Tuned
Charts by StockCharts
Note: Posts on this site are for education purposes only. They provide one firm’s insight on the markets. Not investment advice. See additional disclaimer here.
The Danger Point®, trade mark: No. 6,505,279