Biotech, At The Pivot?

The basic idea around Moving Average ‘Compression’:
The market’s oscillated itself over a period of time, to possible point of inflection.
In the example below, with the weekly chart of biotech XBI, this type of compression is rare.
The last time MAs were this compressed (using 50, 100, 200 EMA) was over fifteen years ago, in late 2009.
Biotech XBI, Weekly

Moving in closer, we have an obvious ‘centerline’, and then potential outer channel lines.
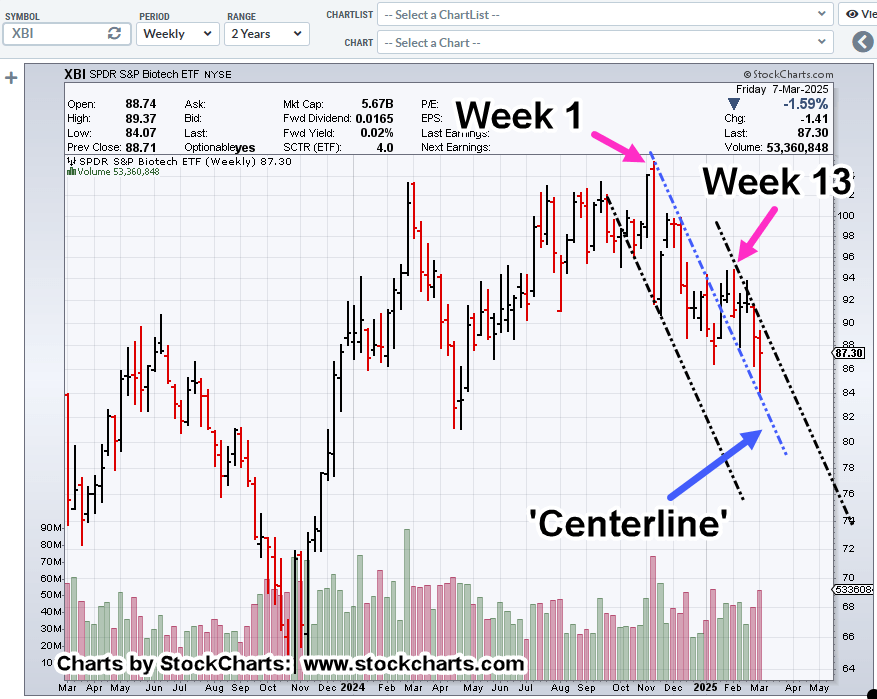
Fibonacci time correlations for pivot points, as noted
There’s also resistance around the 88 – 89 range, to be covered in a later update.
Positioning
As stated in the last update, the short position in biotech XBI (via LABD) is the only open position (not advice, not a recommendation).
The major indices were lower over the past week and ‘normal’ action would be some kind of upside to test.
However, as that last post highlighted, there’s (at this point) no ‘Trump Put’; there are no indications the market will be supported as was done with the ‘Fed Put’ after the ’08 – ’09, meltdown (not advice, not a recommendation).
Stay Tuned
Charts by StockCharts
Note: Posts on this site are for education purposes only. They provide one firm’s insight on the markets. Not investment advice. See additional disclaimer here.
The Danger Point®, trade mark: No. 6,505,279

Pingback: Then, Alcoa Is ‘Compressed’ « The Danger Point®