Bond Reversal

In the past three days, bonds (TLT) penetrated support and stopped dead.

Anytime a market penetrates support or resistance and halts, it’s an indication that something’s up.

Either the market‘s absorbing transactions at that level to continue on, or it’s a reversal about to happen.

With all that’s known on the short position by the speculators as well as another Van Metre report, bank lending standards, probabilities point toward bond reversal.

The dollar is already reversing higher.  Gold has been viciously slammed lower and the overall market’s hovering at all time highs.

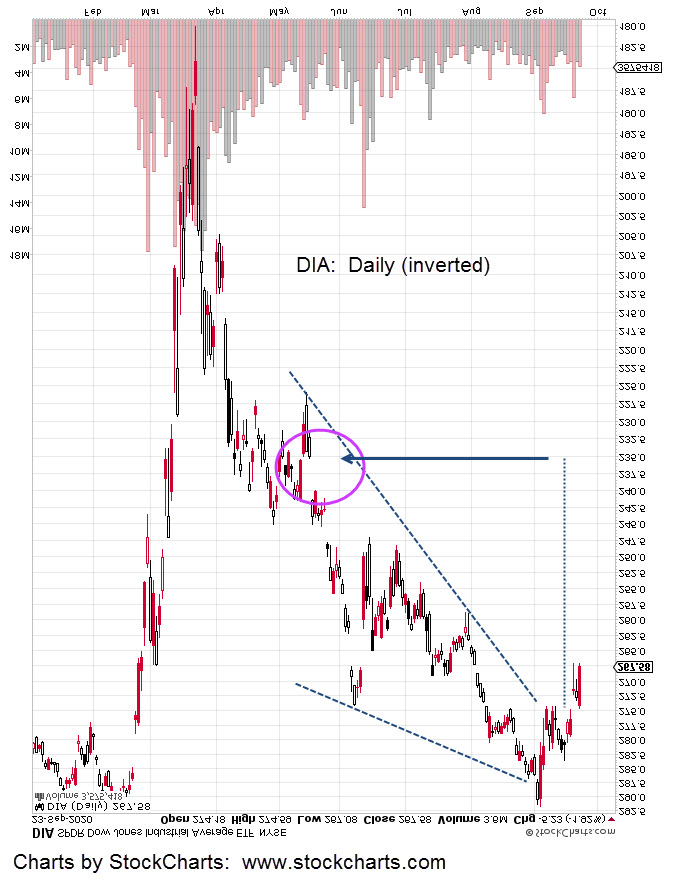
The Dow edged lower at the last session. This session in the pre-market (9:01 a.m., EST) it’s lower again at -1.94 points or -0.66%.

If the Dow (DIA) gets below the 290- area, it’s below resistance and another move higher may be difficult indeed.

We’re short the sector via DXD (not advice, not a recommendation). A new daily low for DIA will allow our position’s stop to be moved to DXD 13.49.

Charts by StockCharts

Note:  Posts on this site are for education purposes only.  They provide one firm’s insight on the markets.  Not investment advice.  See additional disclaimer here.

Mind The Gap

For the past past five years, the Dow 30 has filled every gap … except two.

The ‘election’ gap of 2016 and the ‘election’ gap of 2020.

Looking at the technical condition of the Dow, it’s at an extreme. 

Testing the underside of a trend break while at the same time in a reversal (Wyckoff up-thrust) condition.

A ‘reversal condition’ does not guarantee the market heads immediately lower.

It points out the probabilities that some type retrace may happen before a move higher.

In the current situation, a significant retrace would put the Dow well below resistance; adding to the bearish assessment.

Pulling out to the larger time-frame, the weekly chart puts the current pre-market moves (as of 8:51 a.m. EST), DIA up 0.51%, in perspective. 

The market may oscillate attempting to move higher.

At least three conditions are working against such a move: 

Underside trend line test

Up-thrust (reversal) condition

Lower gap area yet to be filled.

We’re short the Dow via DXD (not advice, not a recommendation) with hard stop, currently set at DXD: 13.13

Charts by StockCharts

Note:  Posts on this site are for education purposes only.  They provide one firm’s insight on the markets.  Not investment advice.  See additional disclaimer here.

Miners (GDXJ): What’s Next?

It’s possible during the last session gold (GLD) received a final mortal wound to the hyperinflation argument.

Price action in the December contract (GCZ20) dropped over 100 points in a matter of hours.

A retrace is expected … it’s just part of market behavior. 

However, even as gold edges higher, the Junior Miner’s, don’t seem too eager to follow suit. 

Price action in GDXJ has risen just slightly with JDST down 0.50% in pre-market.

The dollar (UUP) has reversed as expected.  It’s got a long way to go higher for any kind of test on wide, high volume action.  Dollar higher, gold typically, lower.

The short position in the Dow (DXD) has retraced somewhat in the early hours. 

As it stands now, the retrace is about 1/3rd of the overall gain thus far; perfectly acceptable.

The focus for the firm’s trading at this point is on the Dow and related markets.  If the position is increased at these levels (and the analysis proves to be incorrect), it could be stopped out the same day.

So we’ll wait to add … for now.

Separately, it should be noted that every single market assessment in the previous update was correct:

GDXJ in up-thrust reversal condition … check

GDXJ finished at high on Friday, Monday’s typically down … check

Gold retraced to 50%, lower price action expected … check

Dollar in its own reversal set-up … check

Dollar up, gold down … check

All that list means, is at this juncture the markets are being correctly interpreted. 

Those interpretations are being done intuitively and without indicators.

Intuition can be skewed by events unrelated to the markets.  For now, it’s operating correctly and we’re going to focus on the Dow.

Note:  Posts on this site are for education purposes only.  They provide one firm’s insight on the markets.  Not investment advice.  See additional disclaimer here.

June 5th, 2008.

That was the day where the bear market began in earnest.  After that day, it never looked back. 

The final posted low was 666, on March 6th

Let that sink in for a while:   Six-six-six, on the sixth.  There is much more going on than the general public realizes.

We wrestle not with flesh and blood …

Getting back to that day on June 5th, those old enough will remember the market had been trending lower for about three weeks.

Then, on Thursday the fifth, there was a huge rally.  The S&P moved up over 2% on the day.

This rally as it turned out was just short covering.  The next day, price opened gap-lower and moved swiftly lower to new daily lows.

The move down was about -3.5% on the day.  There was no denying at that point, it’s a bear market, potentially a crash (which it was).

Is that same scenario what just happened today, Friday?

Looking at the analysis that Sajad put out on August 15th   He showed “there’s one final move to go”: Time stamp, 5:20

His quote is shown on the chart.  Indeed, the Dow 30, the DIA, had one more move to go before reversal.

If the coming Monday, opens gap lower and posts a new daily low, the market is performing in a way that’s similar to June 5th of 2008.

Charts by StockCharts

Note:  Posts on this site are for education purposes only.  They provide one firm’s insight on the markets.  Not investment advice.  See additional disclaimer here.

Dow 30: Measured Move

It’s thirty-minutes before the open. Dow tracking ETF, DIA is trading lower about one-point or -0.43%.

The inverted chart of DIA, has a wedge breakout.

Using traditional techniques for a ‘measured move’, we can project to the 235-area for DIA.

When and if that happens, the Dow will have pushed below significant sepport levels that would then become resistance.

Inverse fund typically used for the downside (not advice, not a recommendation) would be DXD at 2X Inverse.

Charts by StockCharts

Note:  Posts on this site are for education purposes only.  They provide one firm’s insight on the markets.  Not investment advice.  See additional disclaimer here.