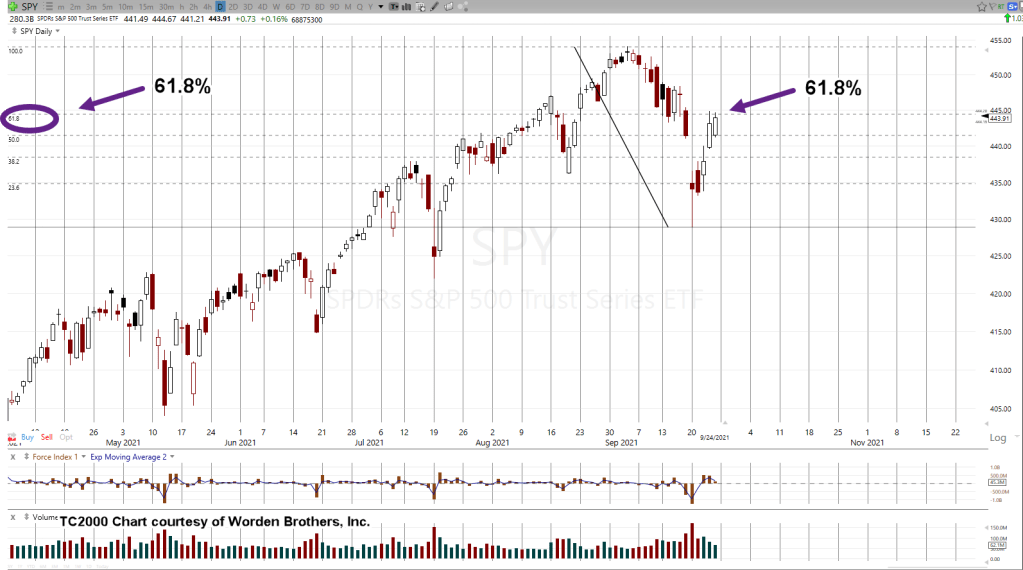
Actually, all three of the major indices, the S&P, The Dow, the NASDAQ have each retraced to (at or near) a Fibonacci 61.8%, level.
The daily SPY is shown above.
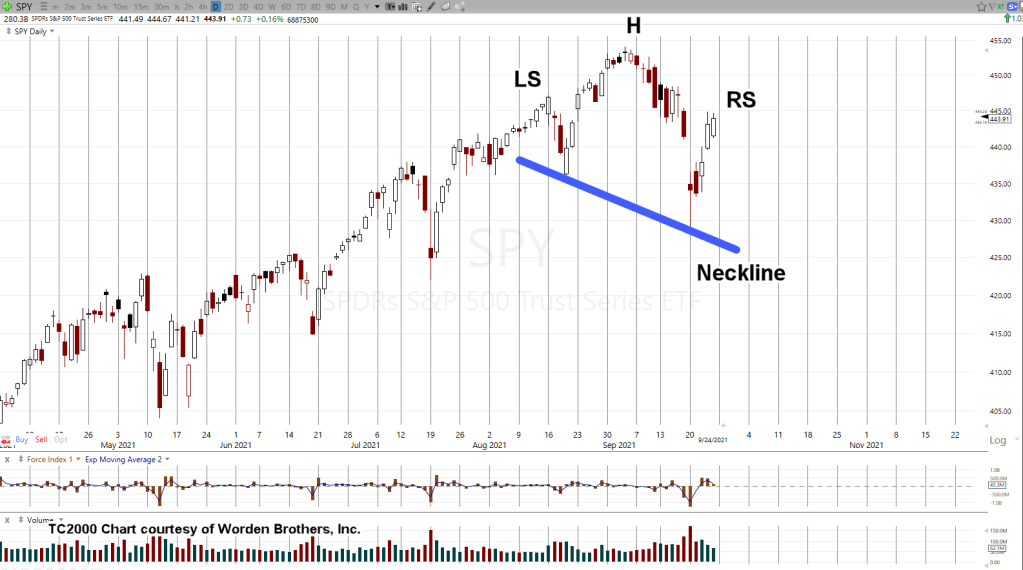
Taking away the Fibonacci retrace levels, then adding notations gives us the following:
It appears we could be at the right side of a Head & Shoulders top.
Price action rolling over from here, then bouncing around the neckline (before breakdown) would let us know, we’re in a significant reversal (not advice, not a recommendation)
Stay Tuned
Note: Posts on this site are for education purposes only. They provide one firm’s insight on the markets. Not investment advice. See additional disclaimer here.
Three markets with key reversals and the biotech sector (SPBIO) posting an inside day.
One other (less followed) market of note with outside down, was basic materials (DJUSBM).
Gold’s (GLD) upward thrust from Thursday the 29th, continues to erode.
One gets the sense that it’s slipping away for the bulls.
SPBIO price action shows the most probable direction is lower.
Expectation for the next session, is for some kind of downside follow-through along with lower market action overall.
Positions:
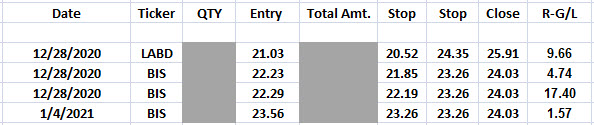
Current positioning remains unchanged (not advice, not a recommendation) being short the biotech sector via LABD.
Market updates for the week will be limited (as the result of travel) and will resume with technical discussions by the week-end.
Stay Tuned
Note: Posts on this site are for education purposes only. They provide one firm’s insight on the markets. Not investment advice. See additional disclaimer here.
‘If you can’t completely ignore the news and the financial press, you will never be successful in the markets’ (emphasis added).
In line with that, we have this: The very first sentence from this article out of barchart is questionable to say the least.
First:
There is no rapid ‘re-opening’. There never was. There is no ‘pent up’ demand.
Massive credit card usage shows the U.S. consumer has been decimated; using credit just to survive.
It should be (but somehow for some, it’s not) obvious we’re in a controlled demolition of the economy (including the food supply) on a world-wide scale.
Second:
Price increases are the result of supply chain (also, controlled demolition) shutdown not inflation.
Uneducated Economist has probably done the best job of ‘boots on the ground’ work to completely dispel the inflation false narrative.
He called the current and now waning lumber price spike two years ago. That’s how you know who to trust or believe. Take a look at their past analysis and see how it ‘aged’.
Third:
The U.S. population collectively, has never experienced real hardship. Those who made it through the Great Depression have all but died off.
There is no one around to give said population a swift kick in the pants and tell them to ‘suck it up’.
Northman Trader
Sven Henrich has come out with an excellent market update, linked here.
Towards the end of his analysis he states; ‘when the break comes, it will be quick, deep, keep going and most (if not nearly all) will be psychologically unprepared.’
Which brings us to biotech.
LABD Analysis:
Biotech SPBIO, is back as downside leader: Down just over -25%, from its highs in February, this year.
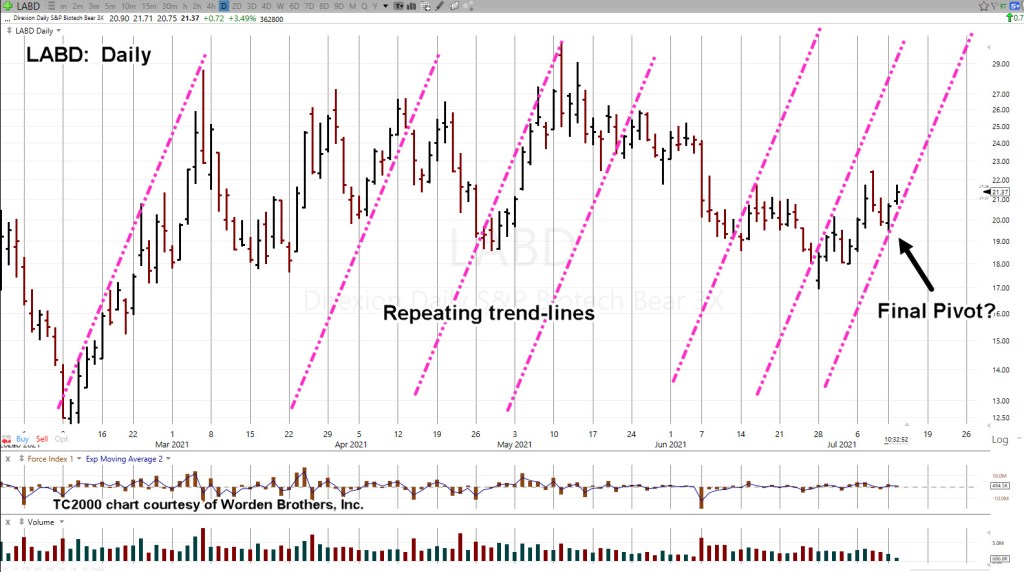
The daily chart of (inverse fund) LABD is below. The market itself is showing us it wants to follow the repeating pattern of trendlines (not advice, not a recommendation).
If the entire structure (from the February low) is actually a trading channel, it’s hard not to overuse the word ‘massive’.
Non Confirmation:
As of this post, the Dow, the S&P and the Composite are unchanged to slightly higher. Yet biotech SPBIO, is down -1.2%.
We won’t know until it’s all over … but it looks like biotech could somehow be the catalyst (along with the dollar and gold?) that precipitates the final reversal in the overall market.
Stay Tuned
Note: Posts on this site are for education purposes only. They provide one firm’s insight on the markets. Not investment advice. See additional disclaimer here.
Note: Posts on this site are for education purposes only. They provide one firm’s insight on the markets. Not investment advice. See additional disclaimer here.
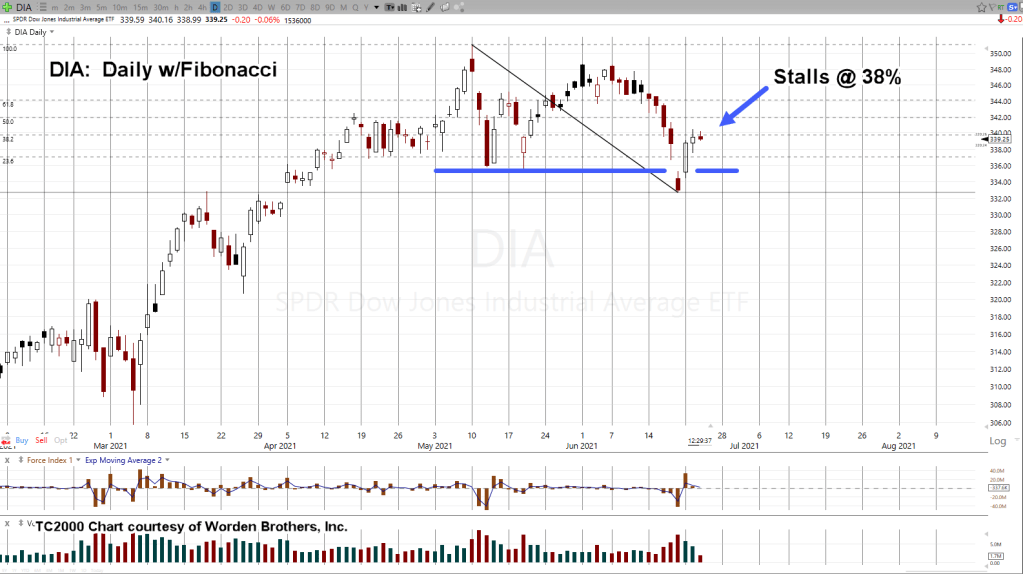
It’s natural market behavior to rebound after a breakdown low.
Stops are hit; Amateurs sell and sell short. Professionals cover their shorts; go long or look to short again.
It’s what happens next, that’s important.
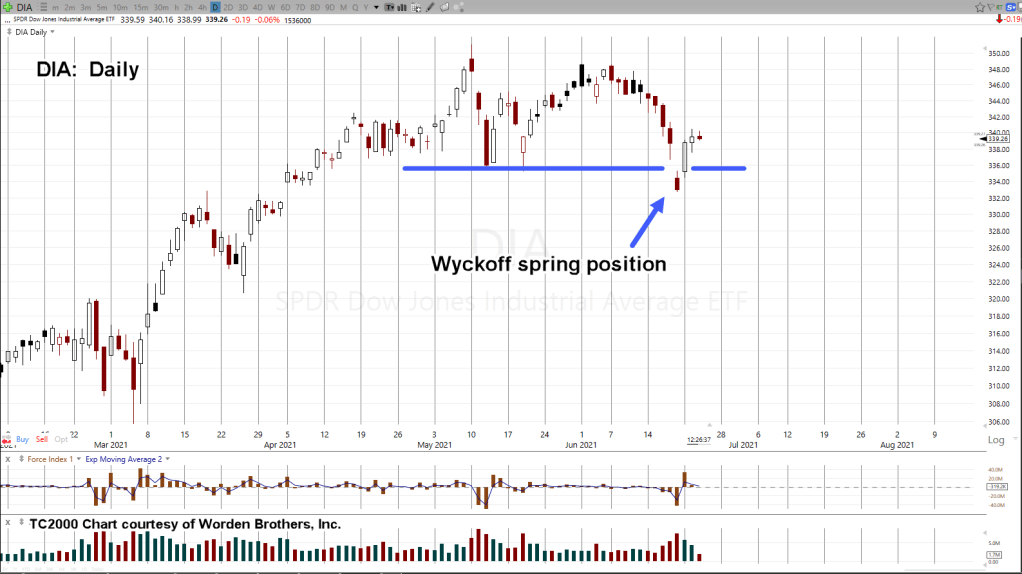
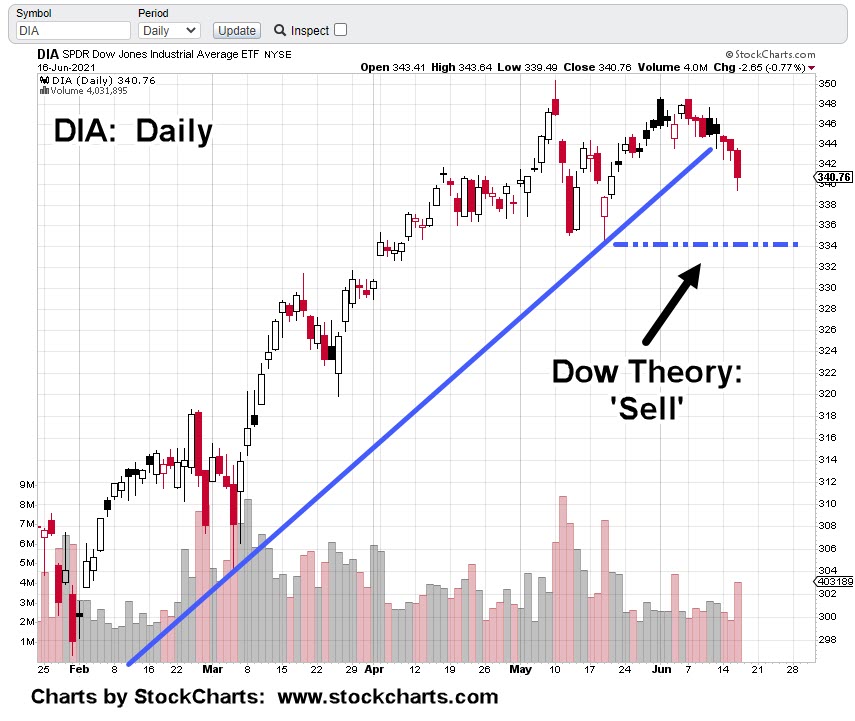
The market, DIA will likely come back to test the support/resistance boundary (blue line) in the daily chart above.
At this juncture, even though Dow Theory Sell was triggered (not advice, not a recommendation) with DIA closing below support last Friday, from a Wyckoff standpoint, DIA is in spring position.
Spring position; the market’s poised (but not guaranteed) to move higher.
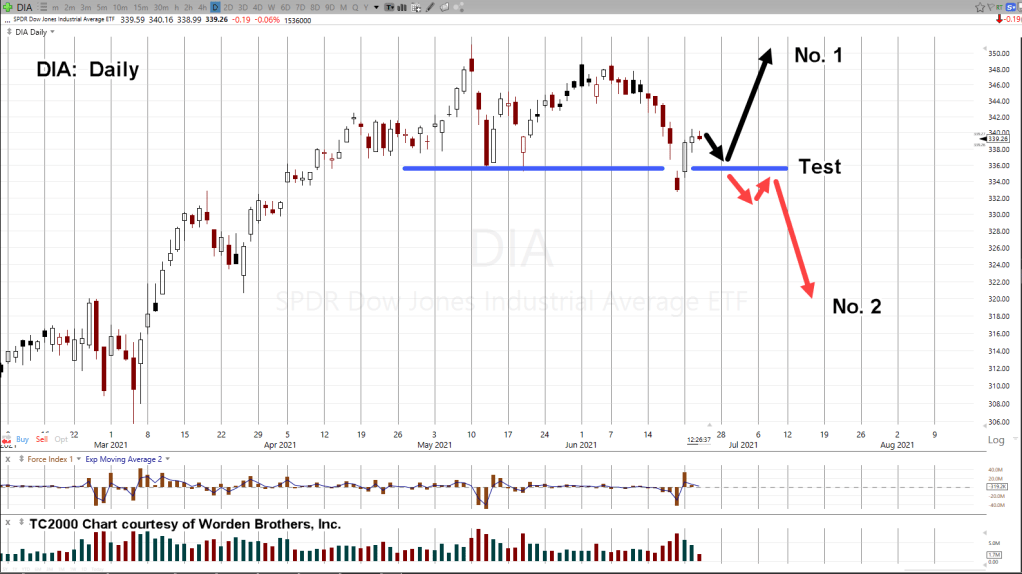
If DIA comes back to test the boundary (typical behavior), there are two outcomes:
No. 1:
The test holds; price reverses and we’re on to potential new highs
No. 2:
The test fails; price re-penetrates the lows and then heads (much) lower.
Adding weight to the second scenario, DIA has already posted a new monthly low. That’s not happened since October last year.
Stay Tuned
Note: Posts on this site are for education purposes only. They provide one firm’s insight on the markets. Not investment advice. See additional disclaimer here.
In fact on June 9th, the day the above ‘penetration’ report was posted, gold (GLD) had already reached its peak and was in a reversal.
Five days later (before the major down-move), this report was published on gold.
Therefore, at this juncture, we’re still inversely correlated.
So, what does that mean?
The updates on the dollar have proposed, since the bullish divergence (now turned rally) is on a longer, weekly time frame, the ensuing move could have the potential to carry the index UUP, to the top of the trading range shown here.
Then, what happens to gold?
If the negative correlation remains intact, gold gets whacked.
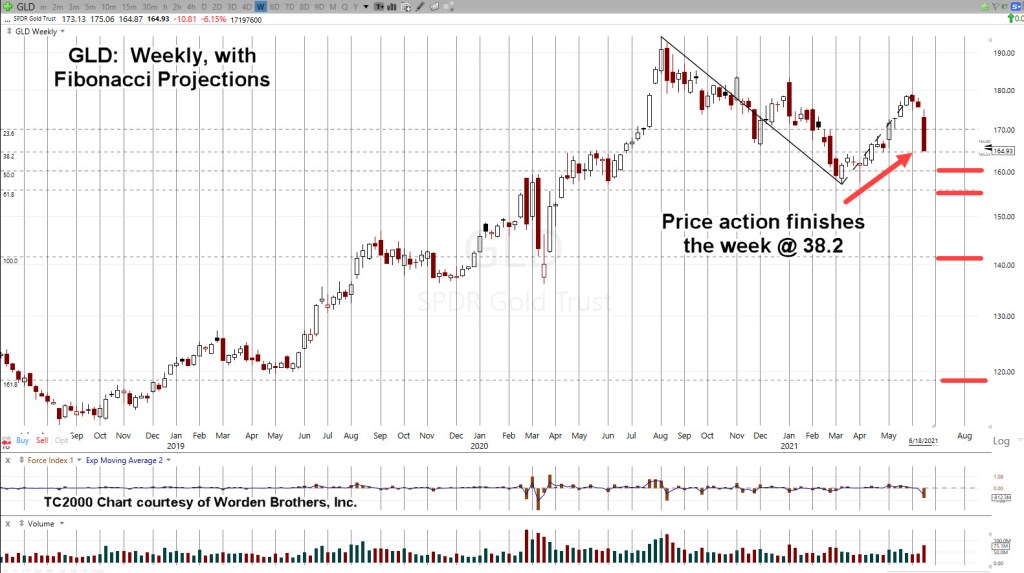
The weekly chart of GLD (above) has the index closing right at the Fibonacci 38.2%, projected level.
Wide bars tend to get tested. There could be some kind of rally in the coming week but it’s not required.
The Fibonacci projections highlighted as the orange bars, go all the way down to 161.8%. That’s equivalent to GLD at ~ 118.65, or the futures market somewhere around $1,300 – $1,350.
With the Dow 30, (DIA) penetrating and closing below the 336, support levels on Friday, we have a Dow Theory Sell Signal (not advice, not a recommendation).
The markets appear to be rolling over.
The last market reversal in February – March, of last year, had GLD dropping over – 14.5%, in two weeks.
Fast forward to now; GLD, is already down over – 15.2%, from its August 2020, highs.
Stay Tuned.
Note: Posts on this site are for education purposes only. They provide one firm’s insight on the markets. Not investment advice. See additional disclaimer here.
Note: Posts on this site are for education purposes only. They provide one firm’s insight on the markets. Not investment advice. See additional disclaimer here.
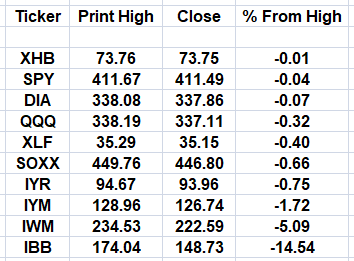
The table lists well known index ETF’s; along with most recent highs and current (Friday) close:
All the usual suspects are there:
S&P 500, SPY, The Dow 30, DIA, Nasdaq, QQQ, and on.
What’s also listed is how far each index (ETF) is from its most recent all time high or ‘recovery’ high (in percentage terms).
Obviously, one of these is completely out of bed: Biotech, IBB
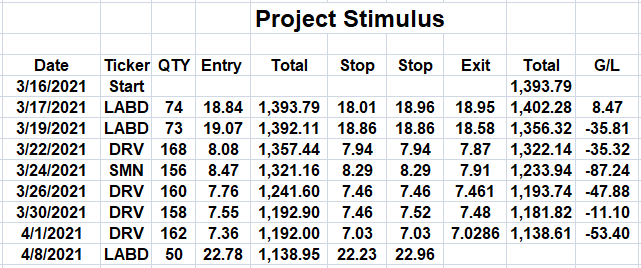
We’ll be discussing the technical condition of biotech tomorrow. For now, the updated ‘project’ chart’s included below:
Note: Posts on this site are for education purposes only. They provide one firm’s insight on the markets. Not investment advice. See additional disclaimer here.
Pre-market action has all major indexes trading lower; SPY, DIA, QQQ, SOXX and IWM; all down.
Real estate, IYR has no real pre-market volume (20-shares) so its open is unknown. However, inverse fund DRV, does have volume (3,700 shares) and its action is up about 4%.
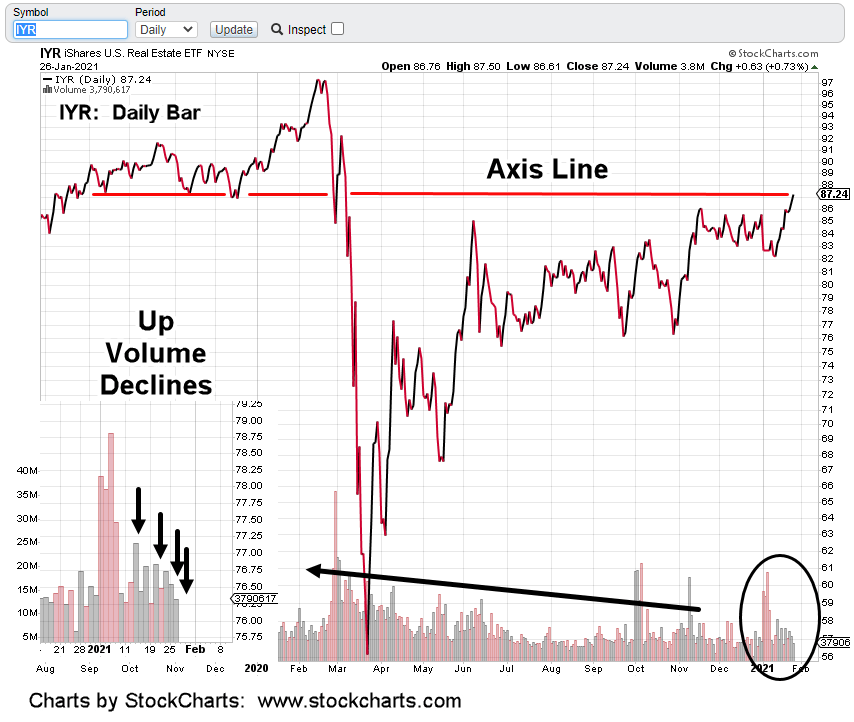
The daily close chart of IYR (above), has price action contacting an established axis line.
That was yesterday. Over the past two-weeks, as price ratcheted higher volume has declined (circled area enlarged).
That decline indicates lack of commitment at these levels.
Yesterday’s close also put IYR firmly in up-thrust position (ready for reversal).
Over the past week, short positions were opened using DRV (not advice, not a recommendation)
Average price of the short equates to DRV @ 9.92; not far from current pre-market trading.
If IYR posts a new daily low (below 86.62), it’s another data point the anticipated reversal may be at hand.
The rising action has changed the P&F forecast reported a few days back. Updates will be forthcoming.
If this is the start of a sustained reversal, the plan is to build the short position as price action dictates.
The downside of the entire market (S&P, Dow, etc.) is immense. Commercial real estate is especially vulnerable. Price action itself tells us that.
Note: Posts on this site are for education purposes only. They provide one firm’s insight on the markets. Not investment advice. See additional disclaimer here.
Note: Posts on this site are for education purposes only. They provide one firm’s insight on the markets. Not investment advice. See additional disclaimer here.