What Happens, Then?

Let’s look at silver’s ‘breakout’ and see where the move might be headed.
A standard Fibonacci projection tool is shown on the silver chart; then, an additional chart (of MDB) presents how it looks, when met.
Silver SLV, Monthly
We’re very near the ‘100%’ projection.

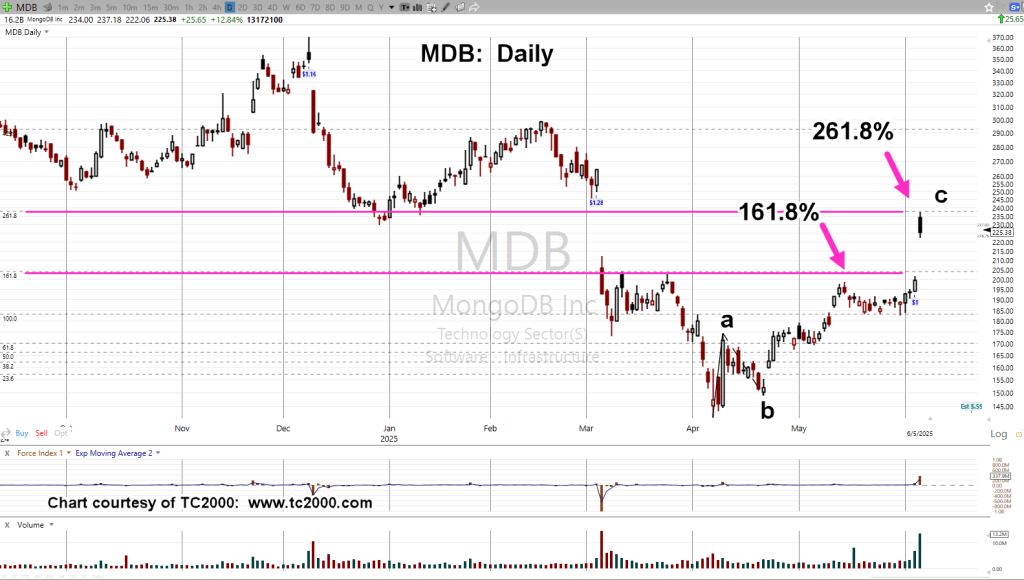
Now, for an example of how it looks when the projection is met (exactly).
MongoDB, MDB, Daily
Price action hits the 261.8% exactly, after the earnings release.
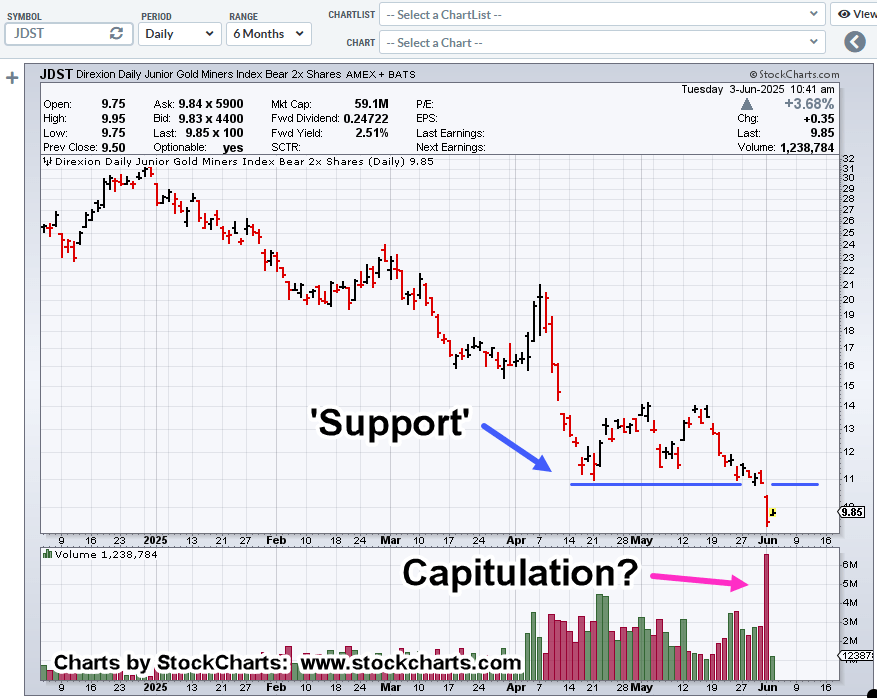
After getting ‘whacked’ on positioning short the miners, all positions closed.
Standing aside for now (not advice, not a recommendation).
Stay Tuned
Charts by StockCharts
Note: Posts on this site are for education purposes only. They provide one firm’s insight on the markets. Not investment advice. See additional disclaimer here.
The Danger Point®, trade mark: No. 6,505,279