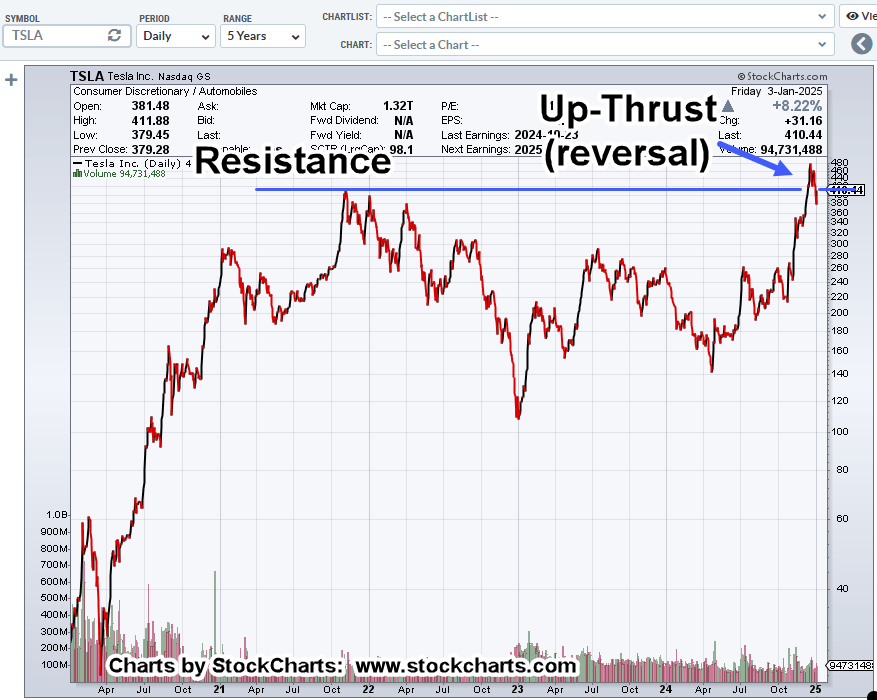
It’s likely we’ll know on Monday, whether or not last Friday’s action was a test (and completion) of the up-thrust reversal shown in the chart.
That reversal and potential test, coincides with ‘good news’, ‘bad news’, link here.
Tesla TSLA, Daily Close
Five years of price action.
Moving in closer to nine months of action.
The ‘resistance’ level goes all the way back to November 4th, 2021, with an all-time high close of 409.97.
Note: Friday’s close of 410.44, was only +0.11%, above the prior (closing) all-time high.
Another Carvana?
Similar to Carvana and its relation to CarMax, i.e., bloated market cap, Tesla has the largest market cap of all (major) auto manufacturers, link here.
Going back to this post on Carvana, volatility reaches a minimum; CVNA, is down a stiff -27.4%, since then.
Note: Posts on this site are for education purposes only. They provide one firm’s insight on the markets. Not investment advice. See additional disclaimer here.
All previous updates on Tesla (TSLA) have been technical, indicating some level of curiosity.
This time, is different.
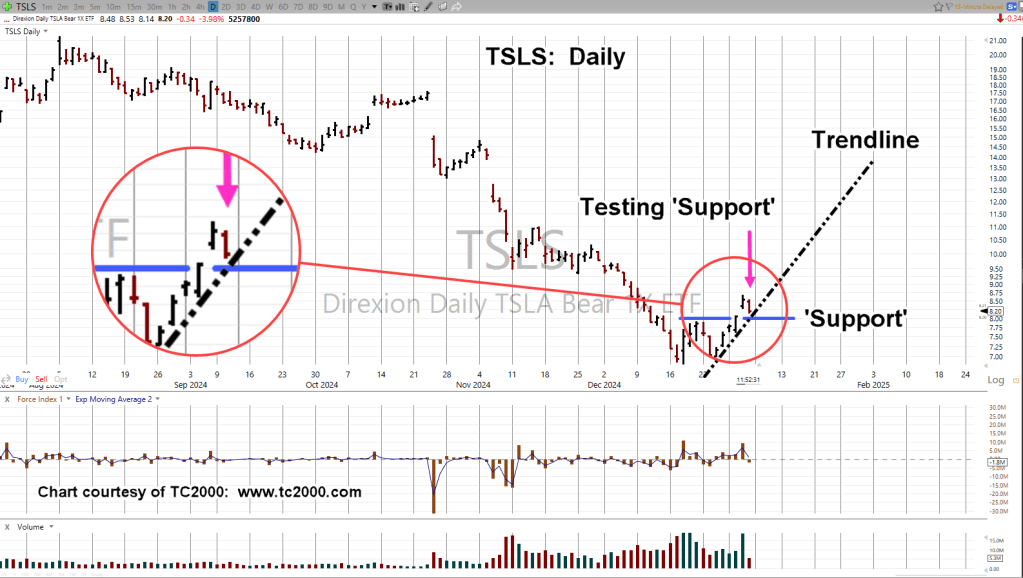
Currently positioned short TSLA, early in this session via inverse fund TSLS (not advice, not a recommendation)
Telsa 1X Inverse Fund, TSLS, Daily
The ‘support’ area shown is actually resistance on the non-inverted chart of TSLA.
As of this post (12:51 p.m., EST), low for inverse fund TSLS is 8.14; if held for the day, it will be the hard stop (not advice, not a recommendation).
Sentiment Warning(s)
Sentiment, Volume, Price; typical model for reversal.
In the case of Tesla, we may have all three (not advice, not a recommendation).
Position(s)
One gets the sense the beginning of this year, has the market sorting itself out.
A brief summary of trade activity for today (not advice, not a recommendation):
DXD-25-01, closed with -1.56%, loss.
TSLS-25-01, opened as detailed above
DUST-25-01, opened … depending on price action, details to follow.
Note: Posts on this site are for education purposes only. They provide one firm’s insight on the markets. Not investment advice. See additional disclaimer here.
With TSLA, price action approaching The Danger Point®, that earnings release is likely to be a catalyst.
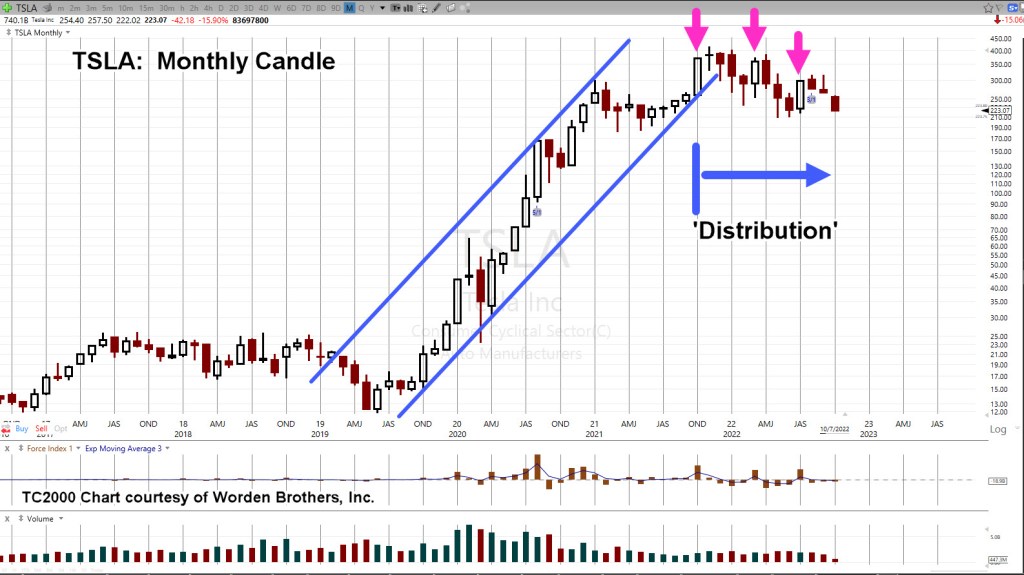
The monthly chart has the trendline (and channel) break along with the distribution phase.
Tesla TSLA, Monthly
Note, each thrust attempt higher (magenta arrows) has subsequently failed.
Thrusts following the first one, are at lower levels.
The weekly chart below, shows what we’re looking for; penetration of support to potentially set up a short-trade (not advice, not a recommendation).
Tesla TSLA, Weekly
When or if that penetration takes place, depending on the depth of the thrust, we’ll have a Wyckoff spring set up … that ultimately is expected to fail.
Ways To Trade
As if on cue and possibly in anticipation of TSLA fireworks, there’s a long and short ETF, for just this ticker.
Released just months ago; TSLS, a 1X inverse (bear) TSLA. The bull side has 1.5X leverage with TSLL.
TSLS, has a 100% maintenance requirement and TSLL, has the same.
Or, one can short directly.
There’s no dividend and the broker used by my firm shows TSLA, has no borrowing restrictions other than a 40% maintenance requirement (not advice, not a recommendation).
Then, there are options … we’ll discuss those if some kind of high probability opportunity presents itself.
The Masses
Let’s not forget the herd. What are they doing/saying?
With that in mind, a random check of our favorite holding pen, SeekingAlpha, has oodles of TLSA analysis.
The most recent is actually quite good from a thoroughness perspective. It admits/discusses the downward pressures and identifies the support/resistance levels discussed above.
Note: Posts on this site are for education purposes only. They provide one firm’s insight on the markets. Not investment advice. See additional disclaimer here.