Down On Heavy Volume

Taiwan Semi (TSM) is the heaviest weighting in both the Emerging Markets, EEM, and the SOXX.
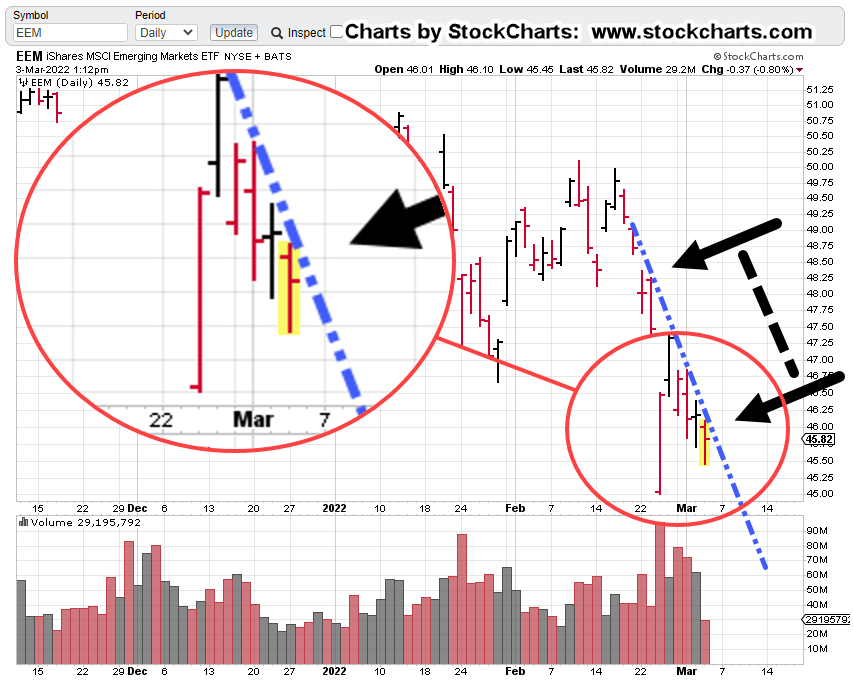
Those indexes were down sharply on Friday with EEM, losing just over -2%, and the SOXX down -2.65%.
Even though the SOXX, was lower in percentage terms, it’s EEM, that may be entering free-fall territory; led by its largest component, TSM.
World (planned) Instability
At this point, that’s an understatement.
There’s no telling if somehow, Taiwan (the nation) is going to be dragged into the fray.
Note: As this post was being finalized, we have this, just out.
The good news (sort of) is from a Wyckoff analysis standpoint, we don’t have to know the inside scoop on who or what has plans to do next.
To be very blunt, those in the know are so arrogant and greedy, their actions are going to show up on the tape.
That same arrogance and greed was rampant in Wyckoff’s day … why should it be any different now?
Taiwan Semi (TSM) Weekly Chart

As we can see, TSM closed the week just below support on very heavy volume.
Downward thrust pressure is immense.
The coming week could see an attempt to ‘relief rally’ or we could just continue lower in earnest.
If TSM breaks lower, it’s in ‘free-fall’ territory as there’s no real support until the 80-area … down nearly – 24%, from current levels.
Leveraged Inverse Fund: EDZ
As covered earlier, the leveraged inverse fund EDZ, has picked up in volatility as well as trading volume.
The daily (close) chart showing the breakout is below:

The second chart documents trade entries and current stop location (not advice, not a recommendation).
The entries may look to be at ‘elevated’ levels but recall in the last report, the market tested its breakdown … tilting probability to the downside (upside for EDZ).
Entries were made at support/resistance trendline break and test … ‘the danger point’
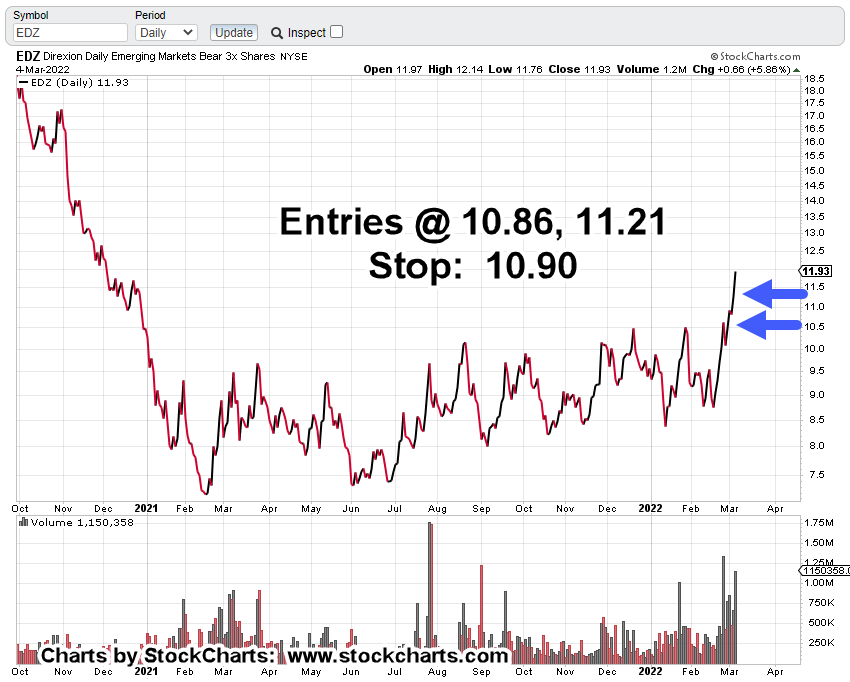
The EDZ, fund typically, is not popular and is normally very quiet; however, that all changed in the past two weeks.
The EDZ, Entry
Let’s dig into the nuances of the entry on the two charts below. From the closing chart above, the entry looks like it’s hanging in mid-air.
Looking the ‘prints’, shows the entries made at (nearly) the lowest risk point(s) possible.
The day prior to the 10.86, may have been the best but recall from this update, the entry was made as price action tested the breakdown of support/trend on the EEM.
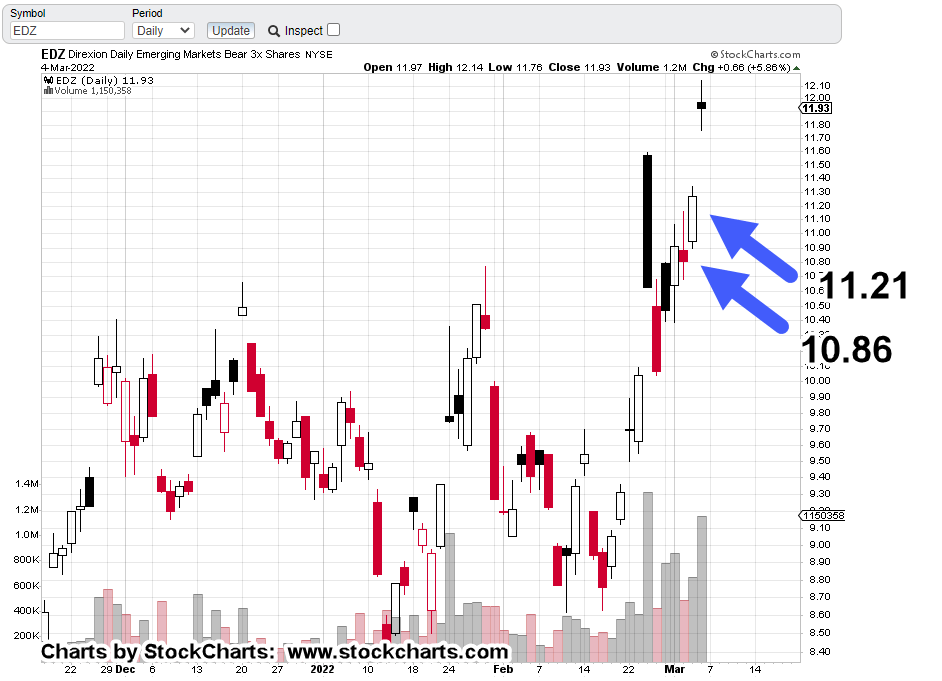
The trade plan for the next day (March 3rd) was if EDZ made a new daily high, the breakout is likely underway.
Another entry was opened (mid-session) as price action pulled back from that new daily high (new low for EEM).
Note the stop was originally set at the March 2nd, low of 10.69, then moved up to 10.90, the next day.
If stopped out at this juncture, the entire trade would be at break-even (not advice, not a recommendation).

Note in the charts above, there were several false attempts to break to the upside. Each attempt was followed one or more red bars (candle) that negated the attempt.
The current breakout looks like the real thing but it too, was initially followed by a red candle (February 25th).
In this instance, price action reversed and started making higher-highs and higher-lows.
That was the signal to go long.
Summary:
At this juncture, trade EDZ-22-01, is fully positioned (not advice, not a recommendation).
Anything can happen between now and the open on Monday. However, the power of TSM’s thrust lower suggests downside continuation is a high probability.
Let’s not forget, we’re in a market environment where a ‘fat-finger‘ upset is not just a possibility but highly likely.
Stay Tuned
Charts by StockCharts
Note: Posts on this site are for education purposes only. They provide one firm’s insight on the markets. Not investment advice. See additional disclaimer here.
The Danger Point®, trade mark: No. 6,505,279