As with natural gas, UNG discussed here, IBB is also at a danger point.
Price action penetrated resistance and closed above that resistance; giving the appearance of strength.
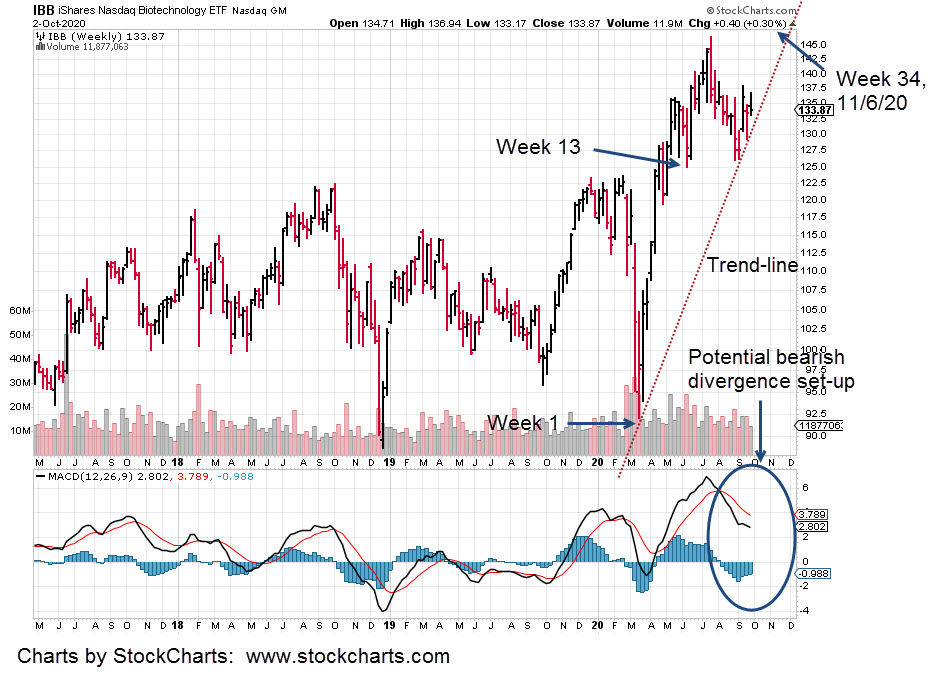
The chart shows Fibonacci time correlations. Biotech, IBB appears to have form and time structure.
To use Wyckoff parlance, IBB is in an up-thrust; a potential reversal condition.
It’s true that a weekly time correlation appears to be in effect as well; At least at this juncture. However, it’s price action itself that’s the final arbiter.
If there’s a retrace below support, then a test (form the underside), we’ve got a good indication of reversal
Note: Posts on this site are for education purposes only. They provide one firm’s insight on the markets. Not investment advice. See additional disclaimer here.
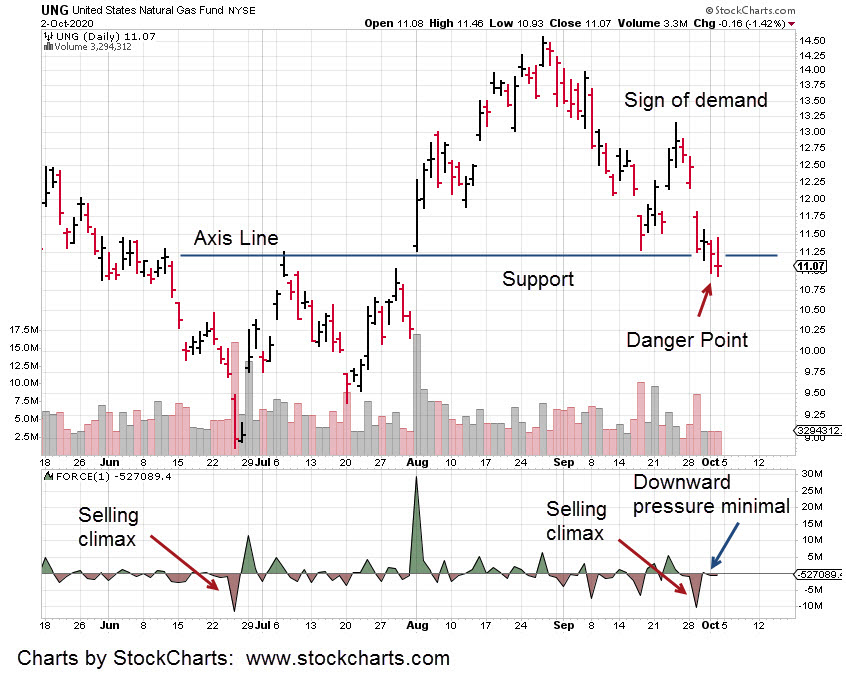
At this juncture, downward pressure on nat-gas (UNG) has evaporated.
At pivots, this price action scenario is nearly always the case.
Way back a century ago, the father of technical analysis, Wyckoff said it best; ‘It’s as if the weight of a feather could move the market in either direction.’
This location was dubbed by his acquaintance, Livermore, as the ‘danger point’.
It’s the point of least risk; Where the margin (gain or loss) of being right or wrong is narrow and easy to see.
Note: Posts on this site are for education purposes only. They provide one firm’s insight on the markets. Not investment advice. See additional disclaimer here.
Biotech (IBB) is trending higher and may reach a top right during the election.
If that happens and then reverses, it may be posting a bearish MACD divergence on the weekly chart.
From the low during the week of March 20th, we see a potential Fibonacci time correlation in effect. A pull back low occurred during the week of June 12th, a Fibonacci 13.
Interestingly, the week of November 6th, is Fibonacci Week 34.
On the sidelines for now; watching for a trade set-up.
Note: Posts on this site are for education purposes only. They provide one firm’s insight on the markets. Not investment advice. See additional disclaimer here.
All of this is happening at the same time. The source at this link does an excellent job of monitoring earthquakes and associated phenomena.
These two links, here and here are good source for weather extremes and crop failures.
Unanticipated weather extremes could launch nat-gas, UNG to levels atypical for a seasonal (winter) position.
One well placed earthquake fracturing gas distribution lines, could do the same.
Typical nat-gas move:
A seasonal nat-gas move, starts around late September, early October and tops out just before December.
The possibility of weather extremes could push that top out into January or February … completely unexpected.
Price action is the key. So far, it’s moving off the danger point to slightly higher levels. We’ve opened a sizeable position and will follow the price action on up with a stop as needed.
Depending on how that action behaves, the current stop level (not advice, not a recommendation) is tentatively set close to yesterday’s low: UNG 10.98
Note: Posts on this site are for education purposes only. They provide one firm’s insight on the markets. Not investment advice. See additional disclaimer here.
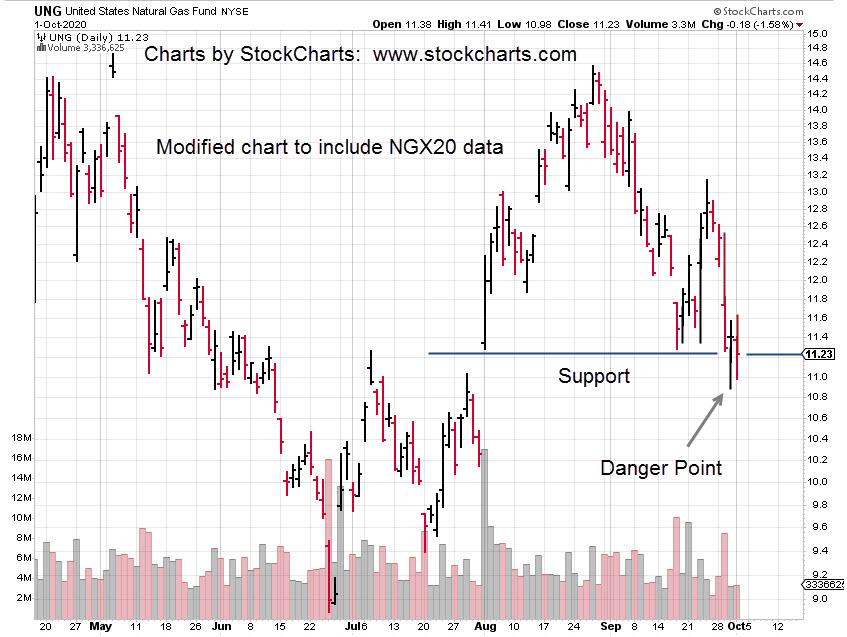
Natural gas trades as a futures contract nearly 24/7. Therefore, the daily chart of UNG is misleading.
Not shown on the standard UNG chart is the most recent low.
That low, in the futures market was right around 7:30 a.m EST on Wednesday, September 31st.
By looking at a chart of UNG, one would think the low for nat-gas occurred today. Not so.
We’ve modified the UNG chart below to represent recent price action on the November contract (NGX20), not shown on UNG.
The low from yesterday’s action is clear. Also clear is today failed to penetrate that low even though a new daily low appears on the unaltered chart of UNG.
In all, it means were at the danger point for natural gas.
Note: Posts on this site are for education purposes only. They provide one firm’s insight on the markets. Not investment advice. See additional disclaimer here.
Instead, we now have a wedge that’s forecasting a move higher.
Using a measure move off a wedge breakout (yet to occur), we can project AMGN to the 290 area.
The expectation is the overall biotech index (IBB) will move higher as well. If so, there’s a potential to form a bearish weekly MACD divergence if IBB makes new highs.
Note: Posts on this site are for education purposes only. They provide one firm’s insight on the markets. Not investment advice. See additional disclaimer here.