After It’s Over, The Press Will State The Obvious

How many times have you heard after a move is nearly over, the financial press will say:
“Well, the easy money has already been made”?
They kept everybody on the wrong side long enough for the professionals to reap a windfall; then act as if you should have known it all along.
Back in 1992, during the presidential election, I watched as a major financial publication put our report after report how the economy was contracting, getting worse.
Then, after the election was over and the incumbent ousted, that very same publication’s next report stated the economy was not as bad as previously thought.
It was my first hint, something was wrong.
Not until many years later, when I determined (airplane) kerosene burning at 1,800 degrees Fahrenheit, could not melt steel at 3,400 degrees; did it all become very clear. 🙂
First Rodeo?
Not for me as you have probably guessed.
If we’re going to trade/speculate profitably in this (financial collapse environment), we need to be awake.
Wandering around with delusions of P/E ratios dancing in one’s head, is not going to translate to profits.
Which brings us to the following question:
Are we in the ‘easy money’ stage of (shorting) real estate?
Is this coming Monday, going to be a continuation to the downside in earnest?
Let’s take a look at the chart of IYR and see what it says.
Real Estate IYR, Weekly
Technically speaking, IYR is in Wyckoff spring position (poised to move higher).
It penetrated below support and has come back to test.
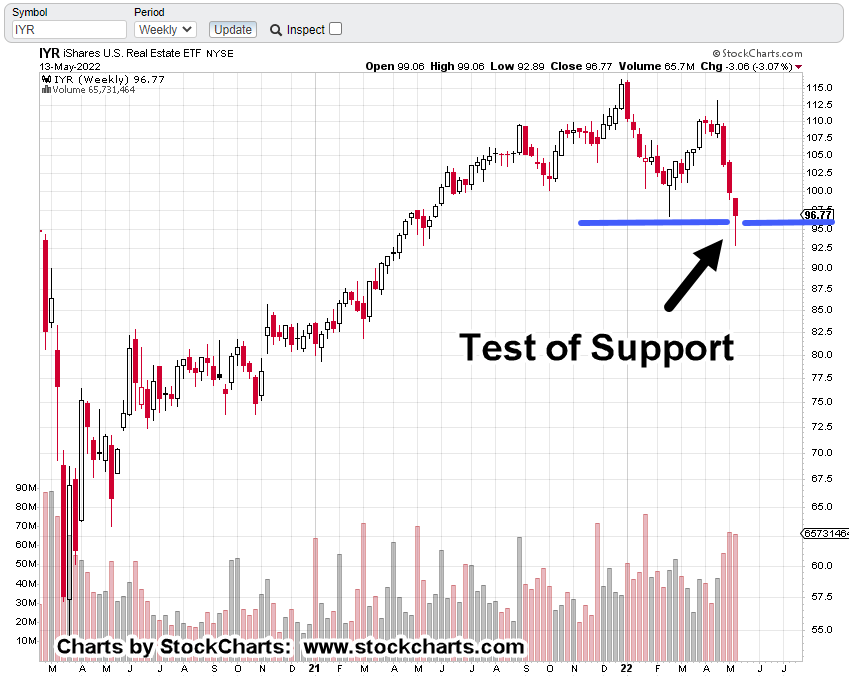
The Problem Is:
Price action went straight down into support (for three-weeks, at least), penetrated, and has now come back up for a ‘test’.
Is more upside a high probability?
Short answer … No.
Could price go higher from here? Yes, anything can happen but it’s not the likely scenario.
Real Estate, IYR Daily Chart
The daily chart shows we’re still in a trading channel. Friday was/is, a test of the right-side trendline.

The smaller, hourly timeframes had their channel lines penetrated; so, we pull successively farther out (in time) to see if the overall structure has been violated.
Looking at the chart above, the channel is still in-effect.
Trading Activity
The table below, is from one of my firm’s trading spreadsheets (not advice, not a recommendation).
It’s self-explanatory, showing a very busy two weeks.
The original position remains active; with Friday’s close of DRV 46.46, that represents an open gain of, + 40%

The Day Trade on Thursday, the 12th, was an attempt to increase the line. However, as the day progressed it became obvious that a reversal (or sorts) was in the works.
That day’s position was closed along with the one opened on the 11th, for an overall gain of + 3.85%
Next Leg, Lower ?
The position opened this past Friday was in anticipation of the next leg lower.
Note: The finger is always on the sell button in case the coming week shows more IYR, upside.
However, price action of IYR itself, is showing that it’s ‘respecting’ the Fibonacci projections as shown below.

Last week’s action confirmed and bounced off the 100%, projection level.
Putting the channel back in and compressing the chart gives us the following … yikes !!!

Summary
If IYR declines to the 161.8% projection, or even farther, expect there to be plenty of panic.
We should also expect to hear from our ever-helpful financial press when they say:
‘The easy money has already been made’
That of course, would probably be true (stating the obvious) and give us a potential confirmation to exit the position.
Stay Tuned
Charts by StockCharts
Note: Posts on this site are for education purposes only. They provide one firm’s insight on the markets. Not investment advice. See additional disclaimer here.
The Danger Point®, trade mark: No. 6,505,279

Pingback: Real Estate … Test & Reverse « The Danger Point®
Pingback: Real Estate … Critical Mass « The Danger Point®