Momentum Stretched Like ‘Never Before’

How do you know it’s a bear market bounce?
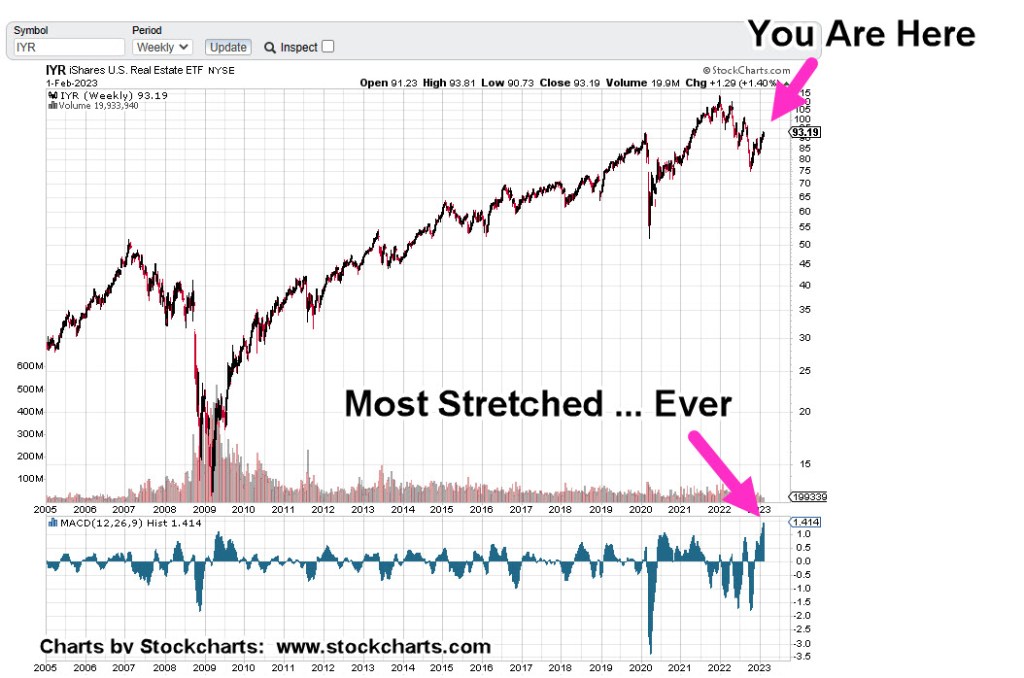
Take a look at the long-term chart of real estate IYR, below.
From a historic momentum standpoint, we’re at ‘never before’ levels.
The chart puts it in perspective.
Real Estate IYR, Weekly
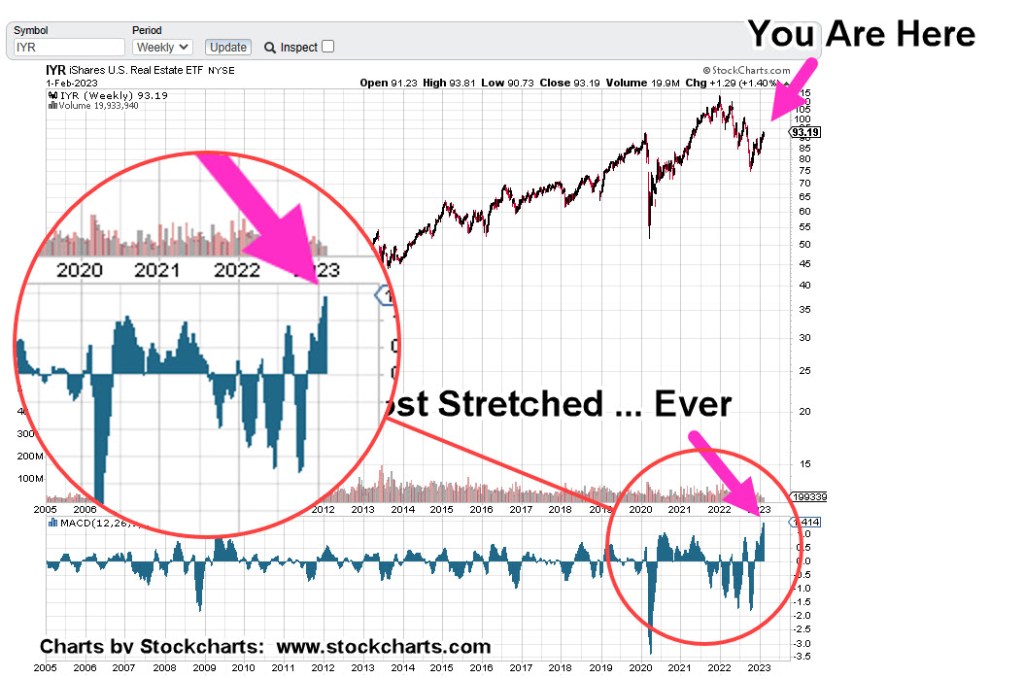
MACD momentum is stretched to (nearly) off the chart.
In the zoom version below, note how MACD histogram made lower lows in 2022, and then immediately launched to an historic extreme in January.
It’s potentially the largest short squeeze in IYR, trading history.
What that means; when we finally get a decisive reversal (possibly this week) the downside potential is enormous (not advice, not a recommendation).
Old vs. New ‘Investor’
Here’s a good read on the differences between those who learn and those who do not.
A paraphrased quote:
‘Whatever bad scenario you can imagine, reality can be far worse.’
In the next update, and depending on price action for the day, we’ll discuss how you author is (or plans to) positioning for the downside in IYR.
It’s about five minutes before the open and IYR, is trading slightly higher.
Stay Tuned
Charts by StockCharts
Note: Posts on this site are for education purposes only. They provide one firm’s insight on the markets. Not investment advice. See additional disclaimer here.
The Danger Point®, trade mark: No. 6,505,279
