Less Volume … Less Energy

Public Service Announcement
Before we get started, recognize there’s a huge public service available with the (media, YouTubers, et al.) discussion on potential gold, silver, rally ‘to the moon’.
Now that Nvidia (NVDA) has posted a reversal, it’s likely the bull market, if not completely over, is seriously damaged.
As Ed Dowd, former BlackRock fund manager suggested, (link here), when the market turns lower, everything’s likely to head down … everything; at least, initially.
The public service: We get to see (in real time) which analysis method is best suited to determine the truth of what’s really happening.
With that, let’s move on to the chart.
Silver SLV, Tracking ETF, Weekly
If this is an initial thrust to move higher, it’s losing energy; narrow range (weekly) bar with volume contracting.
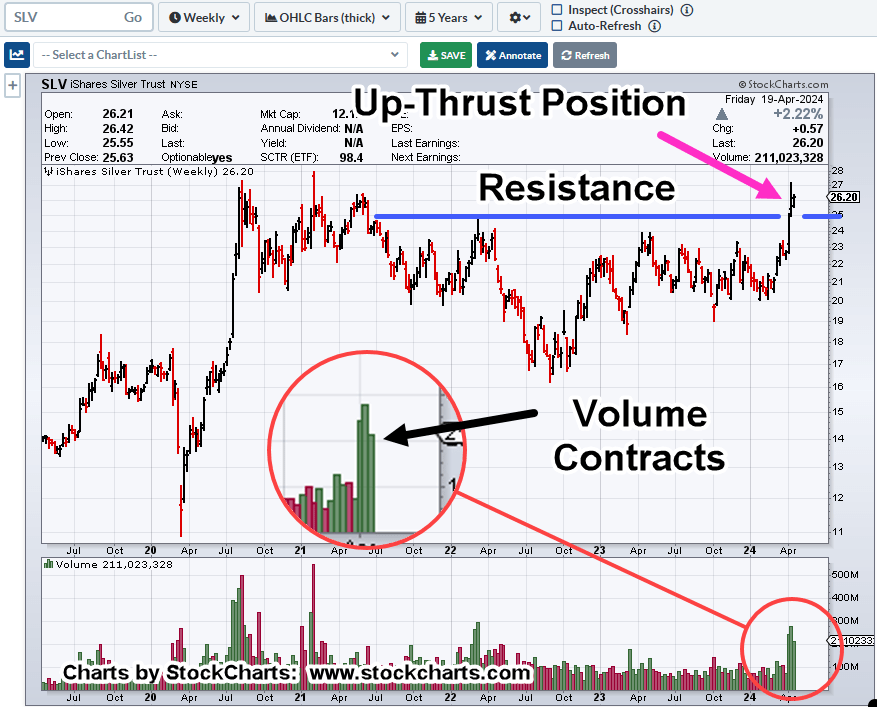
If we’re in an up-thrust about, to reverse lower or consolidate, this is the type of market behavior to expect (not advice, not a recommendation).
Delusional In … Delusional Out
Like the Artificial Intelligence (AI) delusion, hyped-up beyond all conceivable expectations, it takes a while to deflate.
This past Friday may have been the start.
So too, it could be with precious metals.
If indeed, this time is different, and were in a sustained, long term (years-long) rally for silver (SLV), then look for the character of the price action to change.
One potential example of that would be, successive gaps higher of $5/oz., $10/oz., or more.
A real bull market breakout (like the S&P in 1995), does not let you get aboard comfortably.
Note: That breakout in ’95, was a complete shock to the typical market watcher.
The S&P had oscillated in a trading range for a year before launching decidedly higher in early ’95. In that sense, the breakout is/was the complete opposite of the ‘long awaited’ (potential) bull run in precious metals.
The Mood Has Shifted
Anecdotally, the mood appears to have shifted.
If we’ve just past the top in the market (S&P, Dow, SOXX), then expect the social construct to become unhinged.
Here’s just one example of how that looks.
If you thought it was irrational on the way up … what’s it going to be like on the way down?
Stay Tuned
Charts by StockCharts
Note: Posts on this site are for education purposes only. They provide one firm’s insight on the markets. Not investment advice. See additional disclaimer here.
The Danger Point®, trade mark: No. 6,505,279

Pingback: Silver Top … Part IV « The Danger Point®