For Biotech, Both Projections Match

When’s the last time you saw a P&F chart on any (other) website or YouTube, channel?
My guess … probably a long time ago, or never.
Even StockCharts, recently revamped their site, removing the landing page option for P&F. It’s still there, but you have to search to find it under ‘more tools’.
If we’re going to be using Wyckoff analysis to determine the most probable direction for the market (and how far it could go), then P&F analysis is part of that effort.
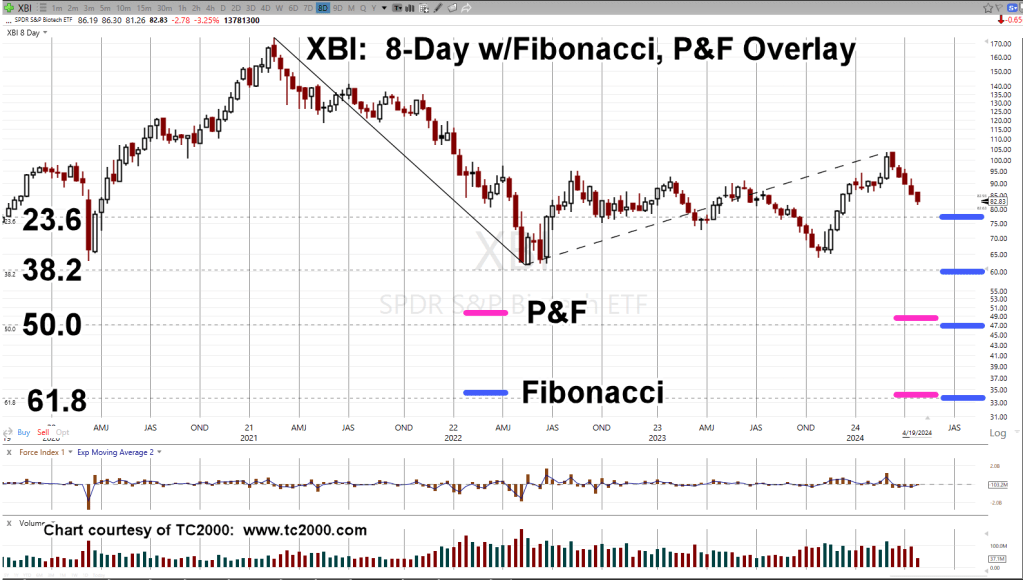
For our biotech example, XBI, we’ve used two projection methods to see where price action is likely to go if we have a sustainable downturn in progress.
Biotech XBI, 3-Point P&F
As a reminder, ‘3-Point’ means before an ‘X’ or ‘O’ is charted (for reversal), the index must move at least 3-points.

Based on the P&F action itself, we have a projection range (not advice, not a recommendation).
Now, comes the interesting part, Fibonacci projections.
Biotech XBI, 8-Day, w/Fibonacci
The Fibonacci projections are shown as the blue lines.
The P&F projections from the chart above, are overlaid as the magenta lines.
Of course, projections do not guarantee anything.
At the next open, XBI could launch itself into a upside reversal; not likely, but it could happen.
Wyckoff Cause & Effect
What we’re doing here, is adhering to Wyckoff discipline from his stock market course material (still available here).
No position, long or short is entered unless there is sufficient cause i.e., P&F count for a sustained move.
Note: I have no affiliation with the Stock Market Insitute and do not receive any compensation from them.
In the case of biotech XBI, above, it literally has spent years generating a P&F count; the ’cause’.
The ‘effect’, is the actual move; now potentially in progress.
Stay Tuned
Charts by StockCharts
Note: Posts on this site are for education purposes only. They provide one firm’s insight on the markets. Not investment advice. See additional disclaimer here.
The Danger Point®, trade mark: No. 6,505,279
