And Then, There’s ‘Elliott Wave‘
We’re heading into the weekend. Who wants to be ‘long’ this market?
In the case of biotech XBI, it may have started the ‘dynamic phase’, suggested two days ago, in this update.
Then, there’s Elliott Wave.
Back in the day, while being mentored by the late David Weis, he revealed his ‘love/hate’ relationship with the method.
His quote to me was “Intermittent reinforcement, is a hook”; meaning, it works just well enough (but not profitably enough) to keep you coming back to ‘get it right’ next time … which never comes.
For me, I’m not going to use the approach for trading decisions, but highlight in the case of XBI, we just might have an Elliott Wave structure (not advice not a recommendation).
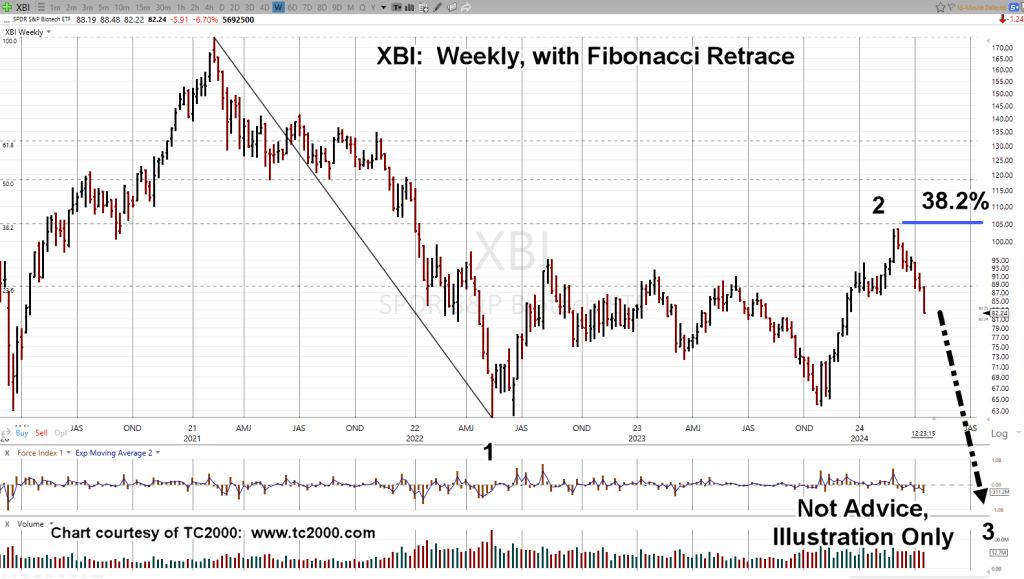
Biotech XBI, Weekly
If this structure’s correct, a lot can happen on the way to the end of ‘Wave 3’.
Note the XBI, topped-out right at the 38.2%, retrace in March (labeled, as ‘Wave 2’), before reversing lower.
Big In, Big Out
The chart above is a massive structure; years of action to form the top, reversal, counter trend wave, then reversal again, which is where we are now.
Stay Tuned
Charts by StockCharts
Note: Posts on this site are for education purposes only. They provide one firm’s insight on the markets. Not investment advice. See additional disclaimer here.
The Danger Point®, trade mark: No. 6,505,279
