Do We Have A Channel?

How do you know if it’s a countertrend move, or an outright reversal?
Do you stay with the trade or, as Dr. Elder said, ‘do you just take the money and run?’
For biotech XBI, it’s been a nasty two days of upside for any short positions, but the real question is, are we there yet?
Looking at the charts below, you’ll have to decide for yourself.
However, from my perspective, it’s possible that ‘today is the day’; meaning, we may be at the top of the correction (not advice, not a recommendation).
Biotech XBI, Daily
The chart is self-explanatory.
From the day a ‘change of character’ was identified to last Friday’s low, is a Fibonacci 21 days.
From that low to today, is a Fibonacci 3 Days.

We’ll compress the chart scale for a bigger picture view of the current action.
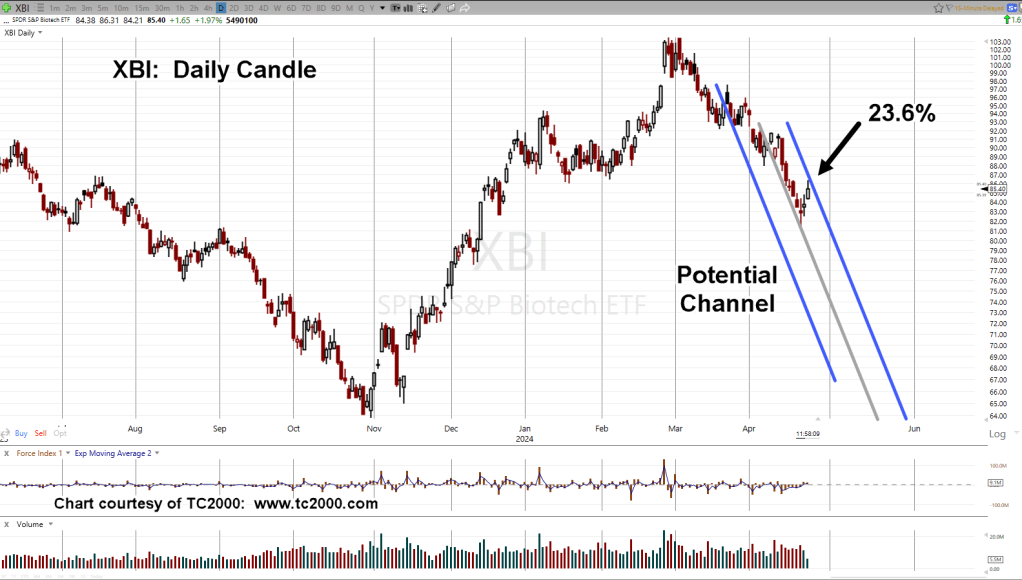
Also included is the grey centerline, showing the channel has a symmetrical ‘look’.
Also note, we’re at a 23.6%, retrace at the day’s high (thus far) and price action appears to be eroding downward.
Stay Tuned
Charts by StockCharts
Note: Posts on this site are for education purposes only. They provide one firm’s insight on the markets. Not investment advice. See additional disclaimer here.
The Danger Point®, trade mark: No. 6,505,279
