Fibonacci, First

We’re letting the market decide what support/resistance, trendlines, and Fibonacci levels are significant.
We’ll even make an attempt to pick the timeframe(s) that best describes current action.
There’s a lot going on in a market sense, as well as ‘behind the scenes’ with revelations like this, and this, and this.
With that said, we’re looking at the 3-Day chart and Fibonacci levels.
Biotech XBI, 3-Day
The 3-Day is being used; it best shows current trending action (planned for next update).
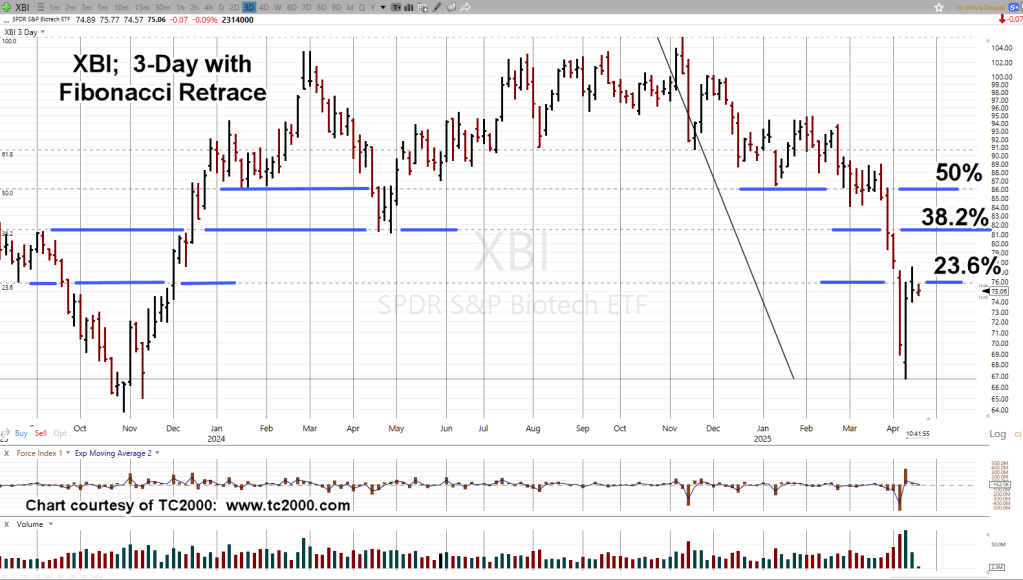
The XBI, has near perfect (Fibonacci) symmetry.
Price action has made its way back to the 23.6%, level, and is hesitating.
Watching the action in real time, XBI gives the sense it does not know quite what to do … is it in a pause, gathering steam to move higher, or was the massive squeeze, on Wednesday, the 9th, all there was?
Positioning
As stated in the earlier update, XBI action on the 15th, put it at The Danger Point®; the location where risk was least for a short position (not advice, not a recommendation).
It’s been slow going since then (ratcheting lower) but the one thing XBI, is not doing … is moving significantly higher.
More trade discussion, stop levels, link here (not advice, not a recommendation).
Stay Tuned
Charts by StockCharts
Note: Posts on this site are for education purposes only. They provide one firm’s insight on the markets. Not investment advice. See additional disclaimer here.
The Danger Point®, trade mark: No. 6,505,279
