Apex, Terminating Wedge

Was the Fed speech a turning point?
Remember, markets typically move in the opposite direction first after the Fed, then resume their main trend.
On Friday, markets were generally higher on interest rate hopes. It’s called ‘hope’, as the Fed’s not actually done anything.
Let’s word that more accurately. The bond market has not (yet) told the Fed to lower rates. When it does (if it does), they will follow and present their case as if they are leading the market.
Decades ago, Robert Prechter Jr., in a research paper, proved this point. More recently, Ed Dowd repeats the fact, link here (time stamp: 37:48).
Markets were higher, including the SOXX, covered here, and in this update, airline sector Delta (DAL).
Delta Airlines, DAL, Daily
If there’s any one chart showing why this site primarily works the short side, this is it.
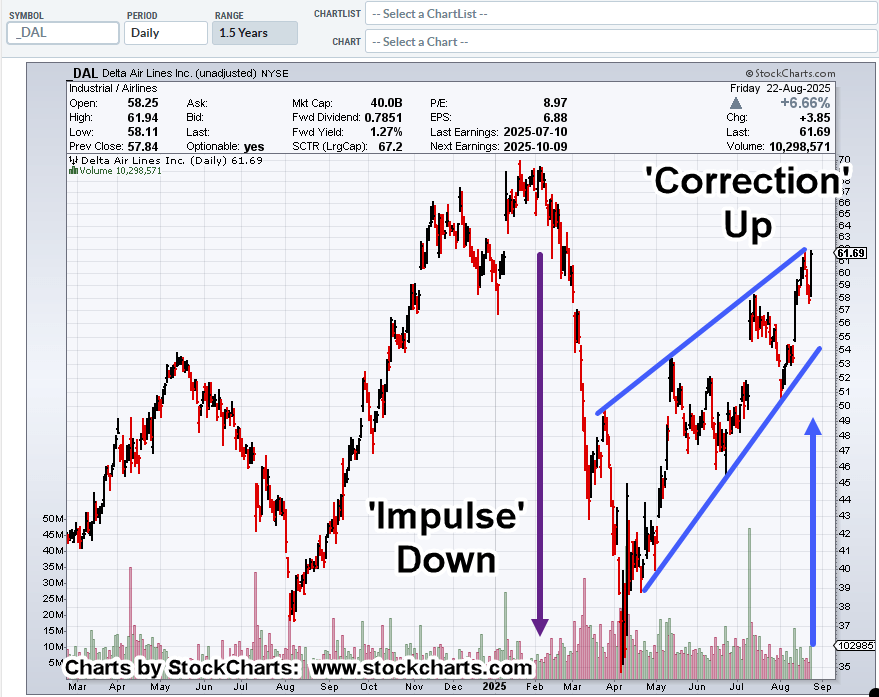
The last major move was an impulse downward, taking less than three-months.
The corrective move against the trend, has so far been nearly five months in choppy overlapping action.
DAL, finished on Friday at the Fibonacci 78.6%, retrace level (not shown). Unless the market decides otherwise, we’re in a terminating wedge.
Currently short DAL, as DAL-25-03, with stop just above Friday’s high (not advice, not a recommendation).
Weekend Wait
Now, the worrying starts … we can almost write the mainstream media script for the next few days.
Why will the Fed need to lower rates? Is unemployment going to continue higher? What about all the mass layoffs? How will the consumer be affected … and on and on.
As a reminder, ‘alternate’ (real) unemployment numbers are here. We’re already at 25%, Depression era levels.
Stay Tuned
Charts by StockCharts
Note: Posts on this site are for education purposes only. They provide one firm’s insight on the markets. Not investment advice. See additional disclaimer here.
The Danger Point®, trade mark: No. 6,505,279

Yep. If you include labor force drop outs and part-time employed, the unemployment rate is much higher. Full time workers as a percentage of the population is on a steady decline. Mike Green just wrote a substack article recently about private fixed investment. Private investment is almost unchanged since 2007.
LikeLiked by 1 person
Thank you,
It’s always nice to get confirmation of one’s own research from an independent source.
I appreciate the help.
The chart that Michael shows at this link tells us the A.I. bubble is just of many.
My own opinion (not advice) reflects that of Prechter, meaning it’s the largest bubble since the South Sea in the 1700s.
Regards,
Paul
LikeLike
You could also dig around into the economic research created by Lance Roberts RIA team. I also like the quarterly reports by Hoisington Management (if you like Lacy Hunt). A word of caution though, through my experience with talking with the public in spaces like Reddit or City Data Forums, overly bearish economic views are met with much resistance. Everyone has their own view of course, but it won’t win you over many fans. I’ve had a lot of arguments over the rising real wage debate. To which I counter argue is only an average and most people do not participate in rising GDP. Median hourly wages are a better measure in my opinion. It’s also worth paying attention to the declining savings rate and the rising consumer credit levels, which are necessary for people to maintain their standard of living.
As for bubbles, check the bolinger bands on the monthly charts. Last I checked (like 6 months ago), on a monthly chart, we are more than 4 standard deviations overbought. If you backtest this, these extreme deviations are always resolved by catastrophic sell-offs. So we should get a mean-reversion somewhere. But it’s impossible to trade a monthly chart, or even a weekly chart, so timing still remains tricky.
LikeLiked by 1 person
I appreciate your extended reply.
In the ‘big picture’ sense, it looks like we’re in agreement. Some type of event is on the market horizon. For all intents and purposes, four standard deviations cover all probabilities.
As for winning over fans or a huge following, if that started to happen in a big way, then I know for sure I’m on the wrong track.
Since my former mentor has passed on (David Weis), this site is used by me as a ‘self-coaching’ tool. Also, since my previous profession was engineering, avionics and aircraft flight test, documenting one’s work is extremely important. So, in a way that’s what is happening here.
I figure that it would help others as well.
Lastly, I am in full agreement that timing is ‘tricky’. No doubt. They way I look at it, if the big reversal is out there, then if I’m doing my job properly, reading price action correctly, I will already be in position when it takes place.
Once again, thank you,
Paul
LikeLike