A Test, Before Down?
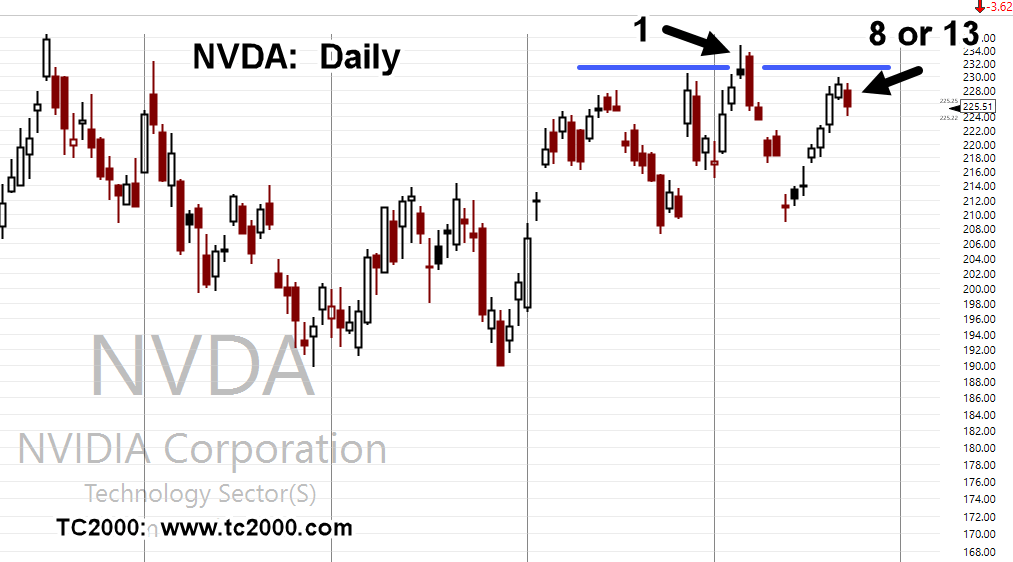
The all-time high is at the far left of the chart.
Then, we have a resistance level, (blue lines), penetrated at ‘1‘.
Today’s red candle is Day 13 from ‘1‘, or Day 8 from the most recent daily lows.
From a Wyckoff perspective, we could look at Point 1, as an up-thrust, followed by ‘sign-of-supply’, and then a test.
Today’s new daily low at Fibonacci Day 8, or Day 13, may help us point odds to the downside (not advice, not a recommendation).
Stay Tuned
Charts by StockCharts, TC2000
Note: Posts on this site are for education purposes only. They provide one firm’s insight on the markets. Not investment advice. See additional disclaimer here.
The Danger Point®, trade mark: No. 6,505,279

