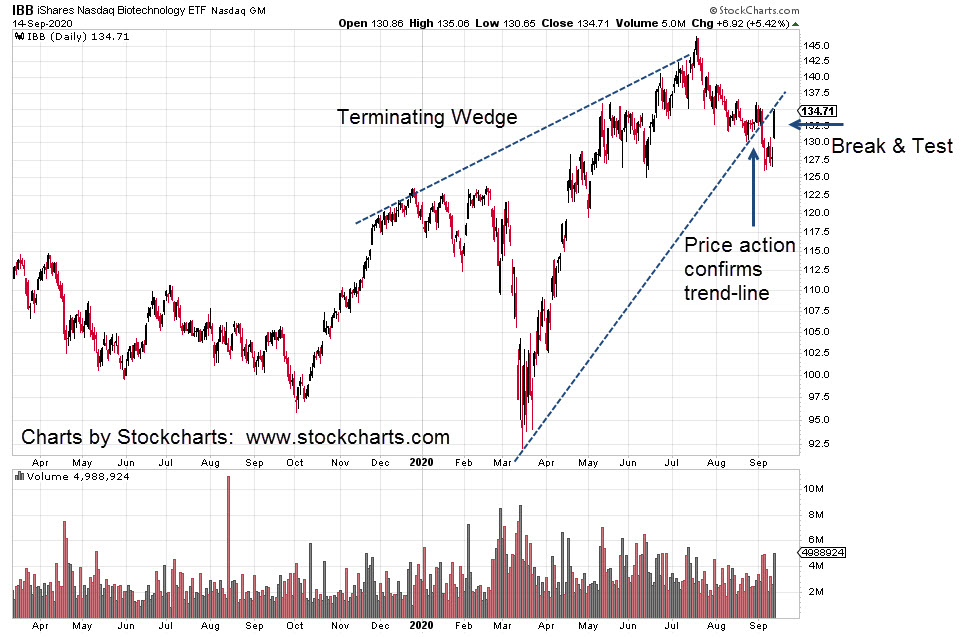
Culmination of probabilities; That’s what appears in Biotech, IBB
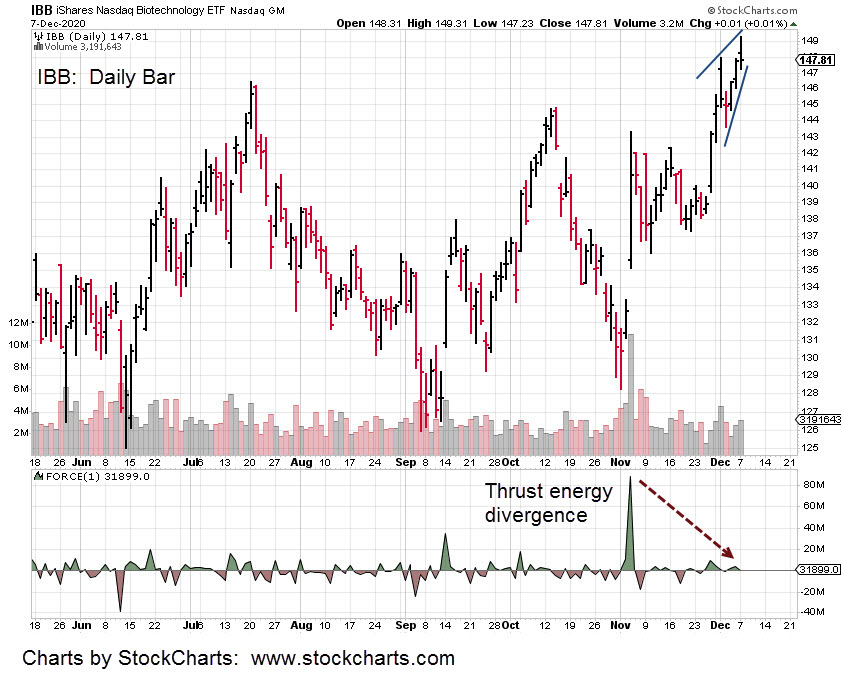
First: The 150 target identified in this post has subsequent price action reaching a 149.31, high … could be close enough
Second: The daily chart has a small terminating wedge pattern created over the last five sessions. A wedge is usually the last stop before reversal.
Third: The amount of upward energy (Force Index) available to push prices higher has evaporated. Today’s session, while closing marginally higher, had near zero energy.
Fourth: Today’s price bar was a reversal; A higher open, higher high, followed by lower low and lower close.
Fifth: The last reversal bar was five trading sessions ago. That bar was negated by subsequent price action; leading up to today.
Markets alternate. What happened the last time (negation of reversal) is not likely to happen this time.
Sixth … sort of. The gold market and the miners (GDX) could have received a ‘safe-haven’ bid in advance of an overall market decline. Did today’s rally in gold just signal the market top?
As of this post (8:02 p.m. EST) the overnight session (S&P) is trading lower -8.50-pts or -0.23%. So, we’ll see.
With the above five items listed and the probable sixth, expectations are for a lower open on tomorrow’s IBB session, then adding weight to the reversal.
Charts by StockCharts