Early or Late?

It may have been Robert Prechter Jr. that said years ago;

‘You’re either going to be early, or late’

He then went on to say his trading method usually puts him in a little early on the move.

That means there are times when the anticipated direction does not materialize.

So, your either suffering through the pain of anticipated reversal (for seconds, minutes, or days), or you’re chasing the market.

You make the call.

There really is no other choice.

Both methods involve psychological pain.

Referring back to Prechter, he also said some of the best traders he knew were former Marines. By definition, they are well trained to deal with pain.

My former mentor, the late David Weis would say after hit on a set-up, if conditions warranted, he would enter again; as he told me, he would ‘stick his chin out’ and effectively tell the market to ‘prove him wrong’.

It was an interesting choice of words for him as one can see from his training video …. he had a distinctive chin.

Trading Style:

The trading style presented on this site is a combination of Wyckoff tape reading coupled with anticipating price action.

As inferred above, that means there may (and will ) be times of draw-down while working to enter a market reversal.

That’s where we are now.
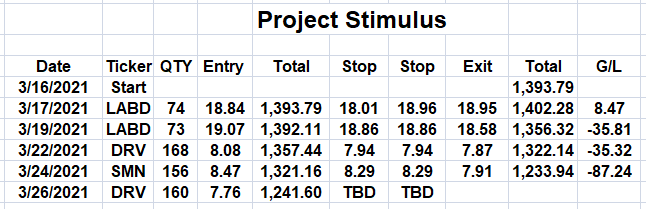
Trade Actions:

Yesterday’s upward action in basic materials forced the ‘project’ out of its short (SMN) position. That sector may attempt to make a new 52-week recovery high before it’s ready for reversal.

Analysis: Real Estate, IYR

One market that did make a new 52-week high, setting up technically for a short, is real estate:

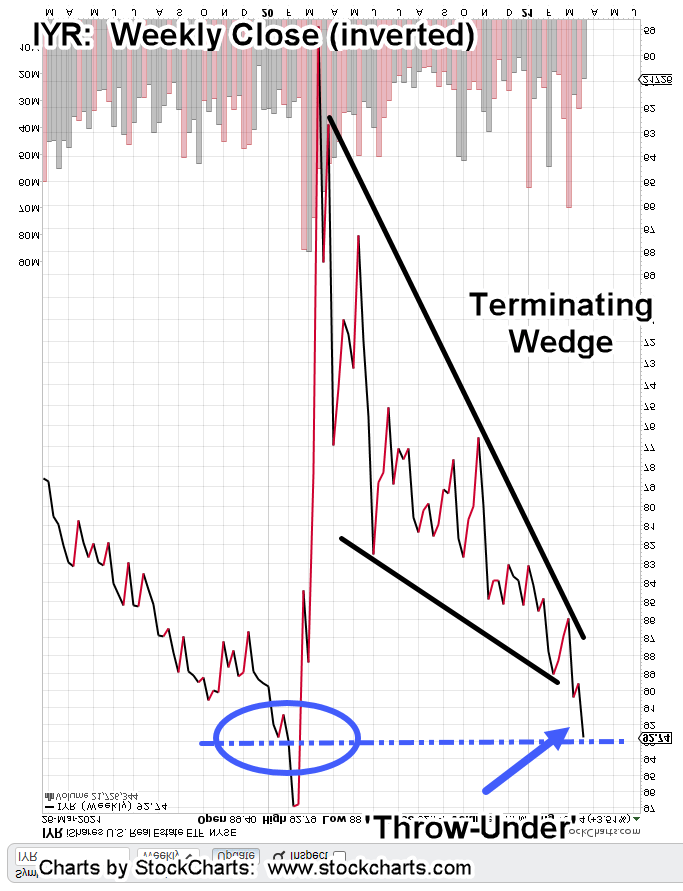
The weekly close of IYR has been inverted (turned upside down) to show the unique technical condition.

IYR has created a large terminating wedge that’s in the process of a ‘throw-under’. At times a market will attempt to breakout of a wedge in the opposite direction of eventual reversal.

This type of breakout tends to fail. Based on the dashed line contacting a prior congestion, there’s’ potential to at least hesitate in this area.

The daily chart below provides additional nuance:

It’s clear price action has contacted two prior areas of support – resistance during ‘throw-under’.

Anything can happen but it seems that IYR’s at maximum extension.

On Friday, IYR price action closed just 0.05-points off its high for the day. That high was also a 52-week high.

We’re now in a support-resistance zone.

If IYR is to move significantly higher, it might need additional fuel (a retrace lower) to break through.

Positioning:

The action then (not advice, not a recommendation) was to short the market via DRV.

Once again, the market itself is telling us where to go for opportunity.

Charts by StockCharts

Note:  Posts on this site are for education purposes only.  They provide one firm’s insight on the markets.  Not investment advice.  See additional disclaimer here.

Evidence of a Top: IYR

Losing power with each attempt to move higher.

The daily charts show it’s clear there’s no more energy left to lift prices significantly higher.

Zooming in on the daily (below), momentum dissipation is evident:

Yesterday’s update said unless IYR posts a new daily high, it’s in reversal.

Price action came back late in that session to close the opening gap … but there was no new high.

The sector’s a juggernaut. When it reverses for good, downside action is likely to be as persistent as the upside.

In other but related markets, the dollar continues its upside reversal while gold and silver continue the downside.

The island gap-trap in silver, has now entered the disillusionment stage.

Retail ‘traders’ disillusioned about getting some tip in a widely followed ‘chat room’ that’s somehow going to make them rich by making only one decision (go long) and having little, or no experience.

Prechter said it well years ago: ‘Be sure to lose your fortune(s) early in life, so you have time to recover.

Even Van Metre’s getting heat and losing subscribers; the bond market’s not providing the necessary ‘good feelings’ for the inexperienced crowd to maintain a position longer than a few blips on the screen.

No matter the market, whether it’s bonds, gold, dollar, or real estate, the big money’s in the big move.

The most frequent condition of the market professional is one of ‘discomfort’.

If you need it, here’s a good source for help on mastering the emotions necessary to be consistently successful in the markets.

Stay Tuned

Charts by StockCharts

Note:  Posts on this site are for education purposes only.  They provide one firm’s insight on the markets.  Not investment advice.  See additional disclaimer here.

Gold (GDX) Target: 38.00

Like GLD, in this report, GDX looks like it’s correcting in a-b-c, type fashion.

The GDX chart shows the Fibonacci projection with target indicated (blue line and arrow).

If the dollar (UUP, proxy) reverses and heads towards resistance 24.75 – 24.80, while gold counter-trends higher, we’ll have a tenuous situation.

Something will break; gold or dollar and probably both. The dollar higher, gold along with the rest of the market, lower.

With so many short on dollar and bonds, if UUP gets to underside resistance, a reversal (to test back to 24.50 lows) could be very short lived.

Keep in mind, when it all comes apart at the seams, it’s likely to be quick.

In other markets, XOP in the pre-market shows a slightly higher open with DUG showing lower.

After the session is over and if there’s a new daily high in DUG, the stop will be moved up (not advice, not a recommendation).

Separately, and as public service, here’s a link to an old article written by Robert Prechter Jr., way back in 1986; what it takes to be successful in the markets.

It’s a good read … probably the most important part is the last bullet item, No. 5  “The Mental Fortitude To Accept Huge Gains”

Stay Tuned

Charts by StockCharts

Note:  Posts on this site are for education purposes only.  They provide one firm’s insight on the markets.  Not investment advice.  See additional disclaimer here.