The Big Picture

Each market session provides another data point, bull, bear, or congestion.
Yesterday’s position in XLF, was stopped out the same day with a minuscule loss.
That trade was an excellent example of operating at the market’s edge and maintaining discipline.
Another data point.
However, one market not making new highs, or threatening the current short position (yet), was biotech, XBI; short trade XBI-25-03.
So, let’s take a look at what’s really going on.
Biotech Sector SPBIO, Daily Close
We’re far away from all-time highs.
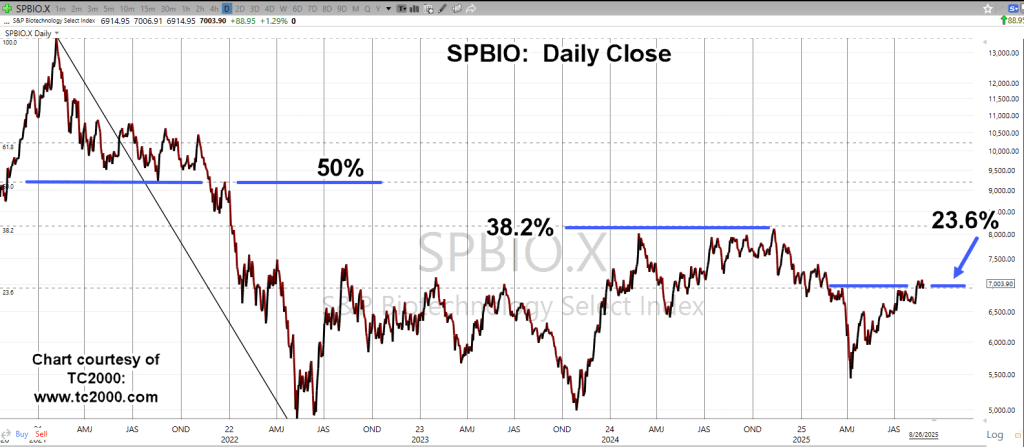
The Fibonacci retracements are shown.
At this point, we’re oscillating around the 23.6%, and in up-thrust condition.
The second chart zooms-in on the set-up.

Set-ups don’t guarantee anything.
They just mean the market has reached a point where risk could be at a minimum.
Bull or Bear
With the SPBIO (XBI as the proxy), we either have a breakout above resistance or an up-thrust as previously mentioned.
Until the market proves otherwise by making new daily highs, the condition continues to be traded as a potential (significant) downside reversal (not advice, not a recommendation).
Stay Tuned
Charts by StockCharts
Note: Posts on this site are for education purposes only. They provide one firm’s insight on the markets. Not investment advice. See additional disclaimer here.
The Danger Point®, trade mark: No. 6,505,279