Way below the media radar, coal prices are reversing off a four-year low. Peabody Energy (BTU) is reversing as well.
Why would coal, a supposed dead product be reversing now?
The list could be endless depending on one’s level of awareness.
Here are a couple of potential reasons.
No. 1
Were entering a 400-year solar minimum with decreased sun-spot activity and colder (much colder) earth temperatures.
The natural result of such activity is a decreased earth magnetosphere and increased cosmic ray activity.
Go outside during a sunny day … the sun’s rays are not warm anymore, there hot! They feel like burning, searing energy on the skin. The magnetosphere is weak, letting more radiation come in.
Under such conditions (more cosmic rays) volcanic activity picks up big time. Scientists (those still honest) have not been able to figure this one out. It just is.
So, we’re one major eruption away from the entire earth being covered with an ash cloud. Bye, bye solar … instantly.
No. 2
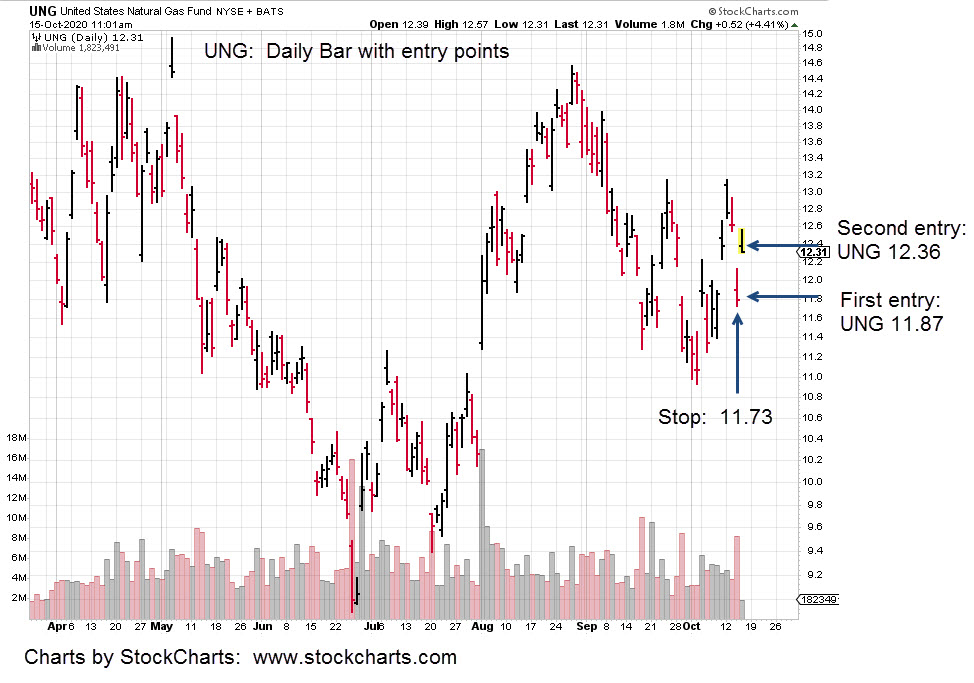
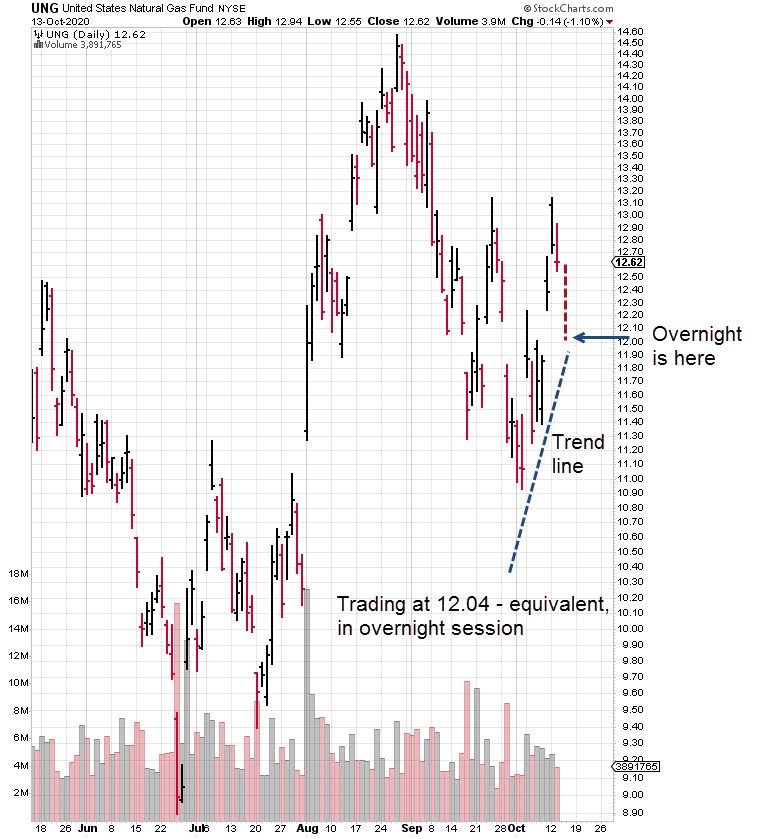
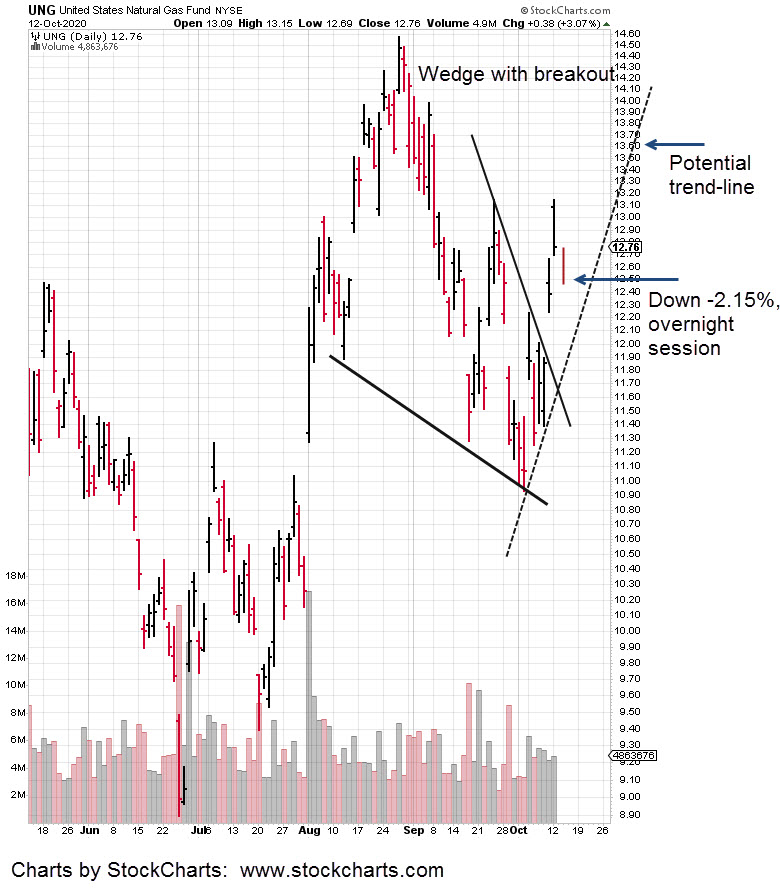
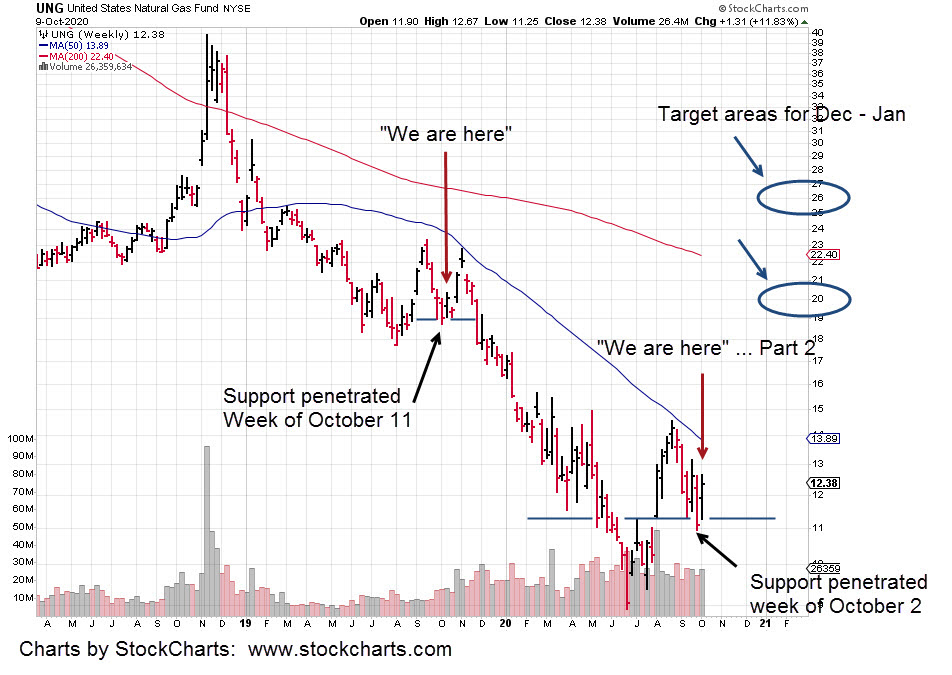
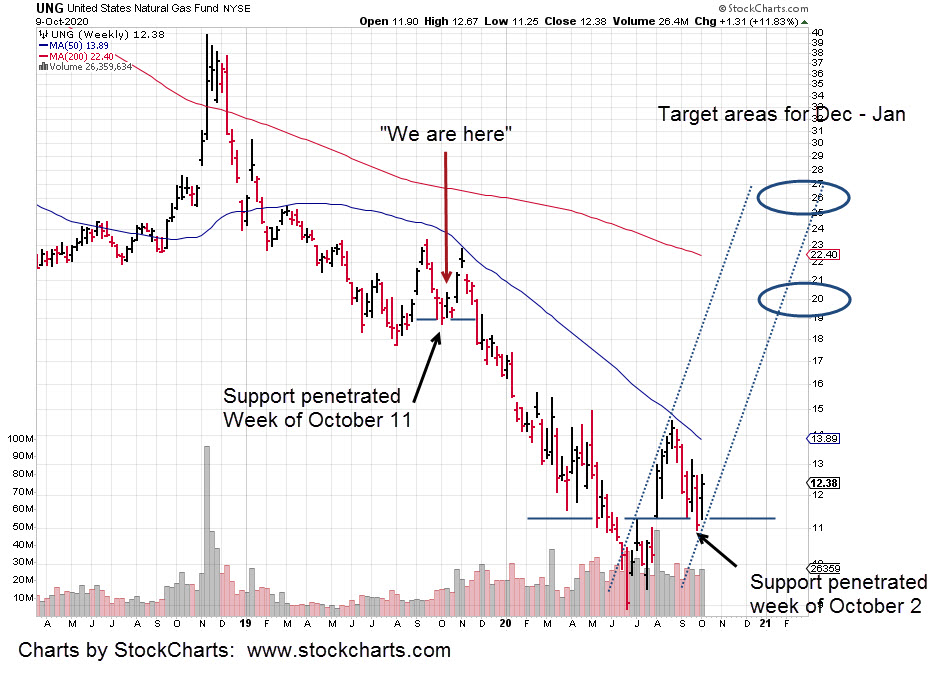
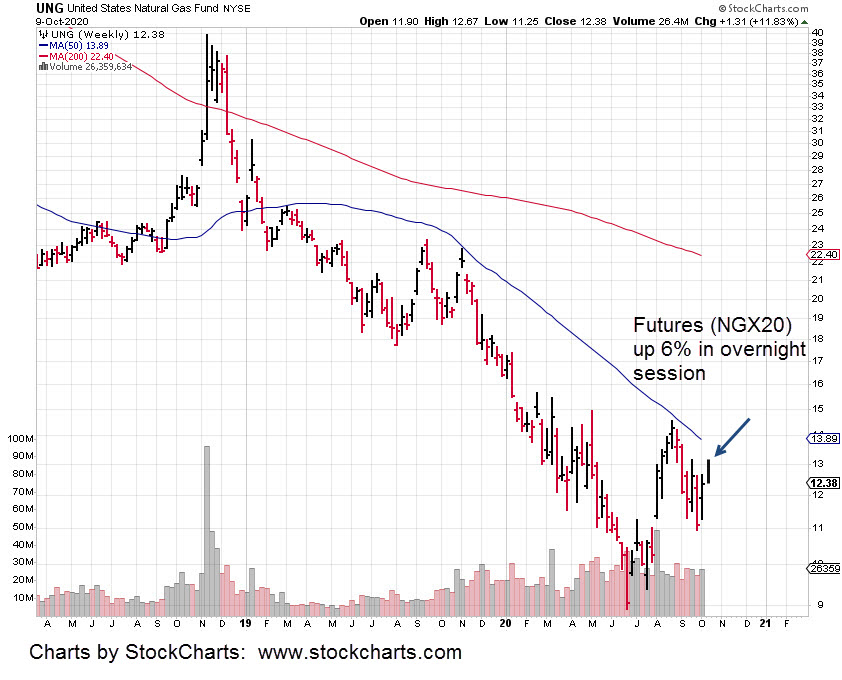
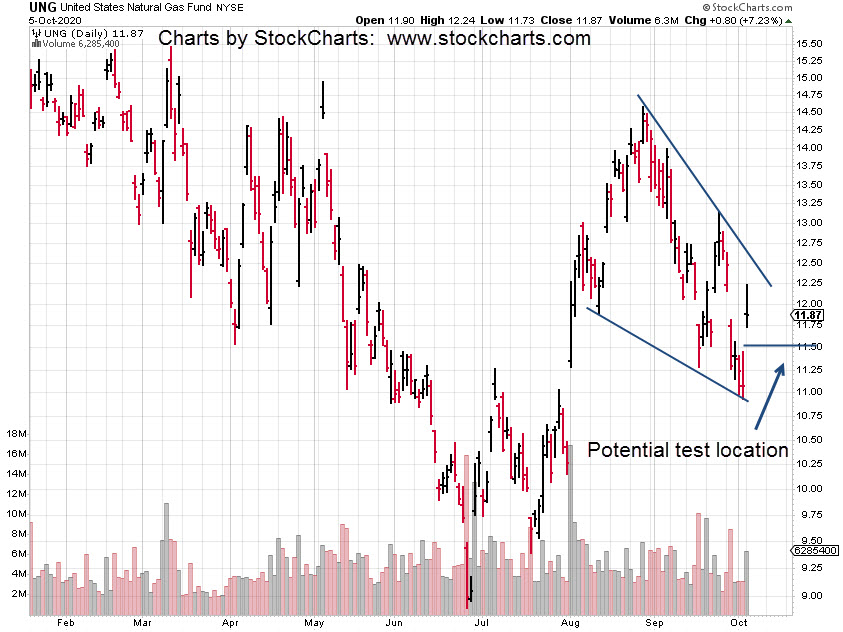
Natural gas prices are rising dramatically. Remember the Winter of Discontent update? That update was spot-on. It also included the level UNG could retrace (which it did) as a test, before moving higher.
UNG is up over 44%, from those levels. One of many (now false) ideas for natural gas, was that it’s cheap. Not any more.
Just two potential reasons for a coal reversal at this point. Those with advance knowledge may be taking positions. We see it in the price action.
As always, anything can happen and coal could resume a downward trajectory. However, if BTU is able to hold above the 2.50-level, it may have already seen its all-time lows.
Keep in mind with BTU, we’re dealing with an equity in serious trouble. It’s not hyperbole to say, the only thing that could save this company is a major reversal in coal prices.

Charts by StockCharts
Note: Posts on this site are for education purposes only. They provide one firm’s insight on the markets. Not investment advice. See additional disclaimer here.


The bond market is key.
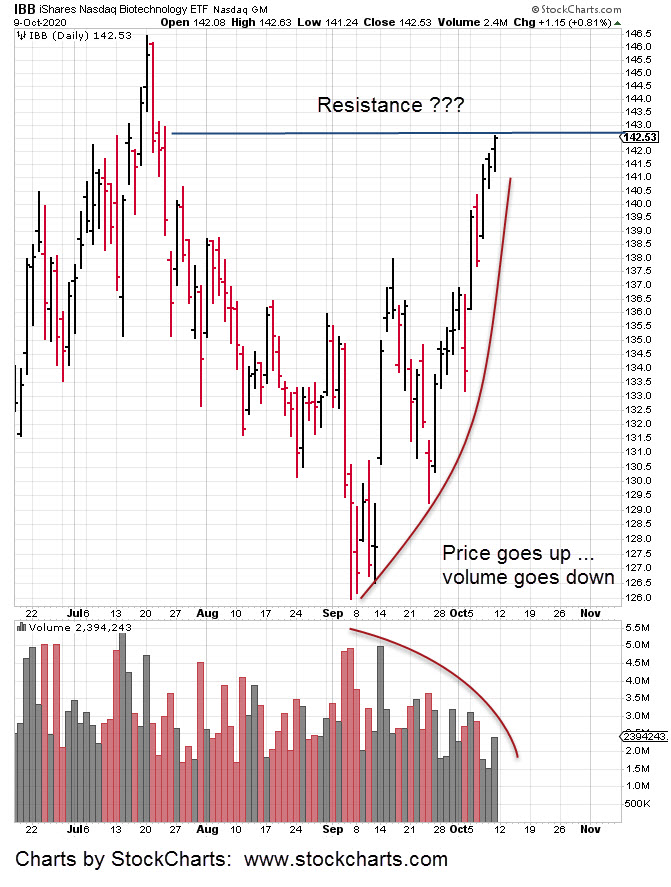
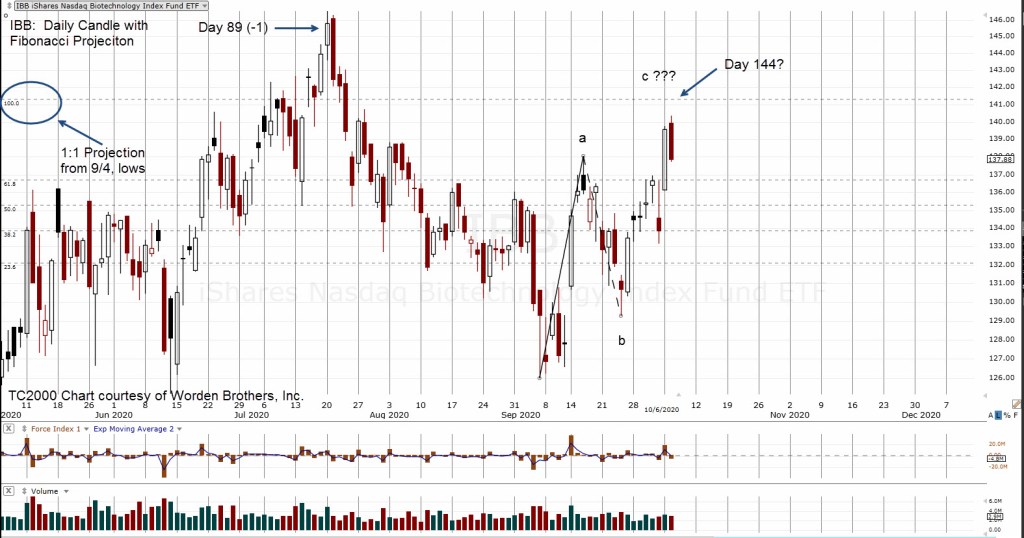
Changes in character; price action, volume or both, tells us something’s gong on behind the scenes.
Those with engineering degrees (including this author) or some other science degree, would have decided long ago, since the original entry’s not perfect (being stopped out), the idea must be wrong.
Prior to the ‘exit’ point shown, we’re positioned long BIS (short biotech). Then, price action broke down through the prior day’s low. BIS was exited entirely.

Meanwhile, back at the farm (literally), the food supply is undergoing controlled demolition.


Maybe it’s stocks and bonds going lower together. No safe havens. Is it possible?
Effectively trading TBT requires a sustained down move in the corresponding market (to mitigate the down-bias). The latest example shows bonds ready to break lower with rates ($TNX) moving higher.
If the chart pattern (below) is in effect, if price action moves according to the breakout forecast, real estate … along with