Biotech: The Movie

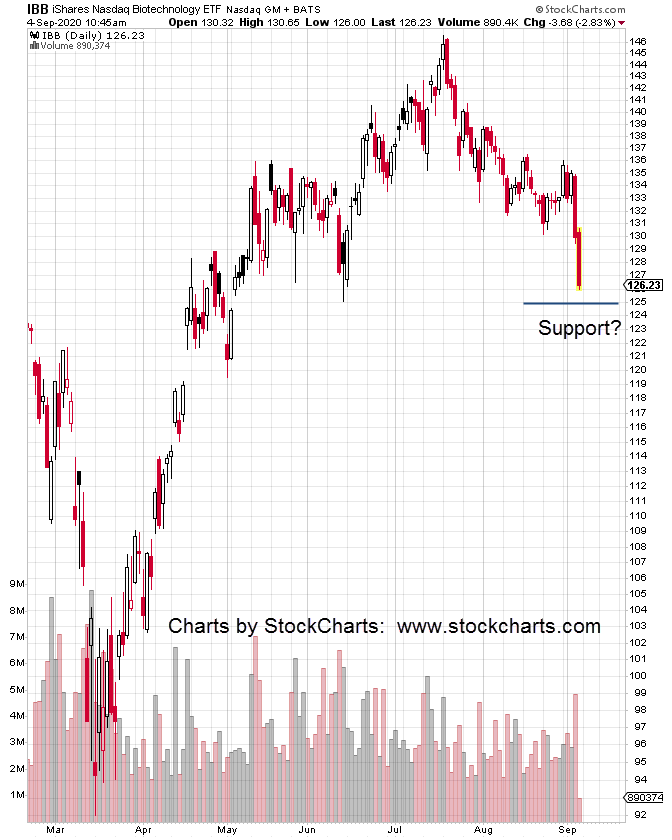
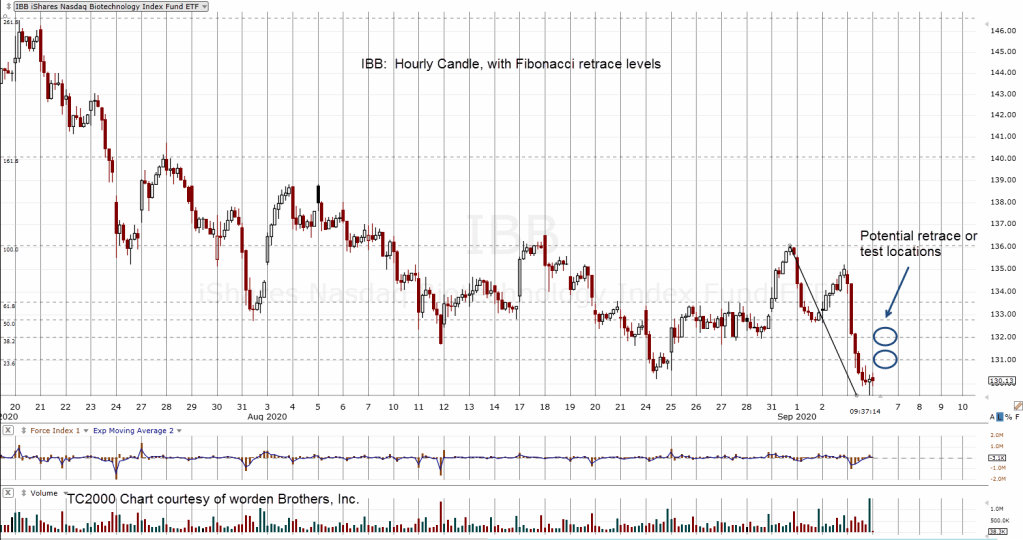
Just before the all-time high in biotech (IBB), several screen shots of price-bar action were obtained.

Pasting it all together in an old-time flip-book format, we see the daily action of IBB over the past two months.

There’s no bonafide indicator that a top was imminent other than increased daily volume at the pivot. 

That increased volume was a subtle clue more volume was not resulting in upward movement.

The next day, price action stalled and reversed.

The result is obvious but below the radar.  IBB has not declined significantly enough, fast enough to draw outright attention.

This is precisely (not advice, not a recommendation) the area where Three Ten Trading established its short position.

In fact, as detailed in this update, the entire short position was exited and then re-established during this two-month long reversal.

The short position (via BIS) is now well in the green but ready to be exited at the first sign of trouble … all the while expecting further IBB downside ahead.

TC2000 Charts courtesy of Worden Brothers, Inc.

Note:  Posts on this site are for education purposes only.  They provide one firm’s insight on the markets.  Not investment advice.  See additional disclaimer here.

Head & Shoulders Ahead

If biotech (IBB) declines from here, it may be in the process of forming a large, bearish Head & Shoulders pattern.

While the rest of the crowd freaks out over Tesla, Netflix and Facebook, underneath the radar, IBB is forming a massive long-term reversal.

Of course, the freak-out is by design.  It’s all part of the plan; Bread and Circuses

Keep the population continuously distracted:  Wear your mask, be afraid, take the blue pill and follow orders; Sounds a lot like a certain European country in the early 1930s.

We’re in a long-term game plan(demic) of unprecedented wealth-transfer. 

Part of this transfer is to keep the ‘market’ rising higher, while underneath, the foundation crumbles.

Those in the know, cash-out.

The vast majority of equities do not participate in the up-trend until the end. That end, is when the top ten, the top seven, the top five all the way to the top one, which at this point is Apple (AAPL), can’t go any higher.

In classical terms, the market ‘thins out’. 

At this juncture and barring any surprise to the up-side, we see biotech (IBB) reached its all time high weeks, even months ago in late July.

There has been a steady, but halting progression lower until the past week.

If the 23.6%, retrace holds, it’s an indicator of substantial weakness in the sector.

Looking to what might be ahead, the weekly chart notations show a potential Head & Shoulders pattern in its very early stages.

A larger, more expandable version of the chart is here.

Fibonacci price projections (dashed lines) have been included to direct us to where price action may stabilize temporarily. 

Those projections are based off the high-to-low and then rebound to the 23.6% retrace.

As always, anything can happen. 

IBB could launch higher at the open on Monday and negate or severely damage the set-up.  However, if it does not and continues lower, the H&S pattern remains in play.

Note:  Posts on this site are for education purposes only.  They provide one firm’s insight on the markets.  Not investment advice.  See additional disclaimer here.

Biotech Hit & Run

It’s one hour before the close; biotech is hitting multiple technical flags simultaneously.

The weekly chart below, shows IBB retracing to Fibonacci 23.6% of its move from the July top.

Then it reversed.

Such a shallow 23.6%, retrace, where 38.2%, and 50%, are more common, indicates severe weakness. 

It’s a harbinger of lower prices ahead.

In today’s session, just minutes ago, IBB posted an outside down (key reversal) daily bar. 

So, we have a daily reversal within a larger, weekly reversal.

To make it technically correct for outside down, IBB would need to close below yesterday’s low of 127.99. So, we’ll see.

The short (not advice, not a recommendation) position via BIS, implemented by Three Ten Trading, has not changed.  In fact, the short position has been increased since the last post.

There’s been no major break in IBB, yet.  No air pockets, no negative news announcements.

As Livermore said a century ago (in 1923), ‘surprises happen in the direction of trend’.

The trend of IBB is down.

Let’s see what happens next.

Charts by StockCharts

Note:  Posts on this site are for education purposes only.  They provide one firm’s insight on the markets.  Not investment advice.  See additional disclaimer here.

Winter of Discontent: Pre-Market Update

Update (9/9/20, 8:11 a.m. EST): UNG, shows pre-market action trading higher, +2.11%, as expected.

Original post (9/8/20):

Natural gas and more specifically, the tracking fund UNG is at its trend line; A trend line that’s been in-effect since July 31st, this year.

The Winter of Discontent post on natural gas, indicated a major long-term reversal.  That analysis was complete with a test location (shown on the chart below).

It’s important to note, the test level was identified thirteen (trading) days in advance.

There was plenty of time to monitor price action, perform additional research and generate a supporting case before the test zone was reached.

UNG subsequently tested that level and never looked back.

Now, UNG has penetrated support (at the 13.00-area) and contacted its July trend line at the same time.

Essentially, in Wyckoff terms, it’s in spring position with the added technical condition of being at trend.  For more on Wyckoff “springs”, see this publication.

This exact point is the ‘danger point’.

If UNG does not immediately bounce higher (at the next session), the trend may be broken and we’re right back into a possible continuation of the bear market that’s been in effect for years.

It should be noted that ‘danger points’ are also the location of lowest risk.  Verification or failure of the move is not far away in either market direction.

Charts by StockCharts

Note:  Posts on this site are for education purposes only.  They provide one firm’s insight on the markets.  Not investment advice.  See additional disclaimer here.

Only the Beginning?

Biotech vaporization could go thermonuclear.

That was a potential outcome proposed in this update, just seven days ago. 

On September 3rd, five days ago, Biotech (IBB) had its largest down-draft since June 11th.

Coincidentally, on that same day, this news was released concerning polio outbreaks in Africa.

Scroll down the article and a familiar name will appear.  It’s also the name that has provided significant backing for Moderna (MRNA).

Moderna has fallen off the radar.  MRNA, with no P/E and no yield.   What?  Nobody wants to stampede into the ‘cure’? 

The top of Moderna was identified in this post.  Along with a summary that enough of the public had been fleeced on the way up; it was time to get them on the way down.

MRNA is now down 34% from the top and down 23% from the last update. 

That might sound cruel or harsh to discuss the markets in this way.  It’s not nearly as bad as what Dr. Elder describes in his first book; Trading For A Living (summarizing):

‘The markets are like a medieval battlefield.  You enter with full knowledge you may not come back.  You are trying to kill your opponent, and him, you.

If you lose, all you own goes to him, including the wife and children.’

So, being part of the herd, stumbling around in the markets waiting to “fleeced” sounds way better.

The original premise of going short biotech was technical, fundamental and political. 

Technically biotech (IBB) is the only sector with a weekly MACD sell signal as identified in this post.  Fundamentally, we’re using Stockman’s assessment the sector is ‘bottled air’. 

Politically, the elites may be starting to fight amongst (and eat) themselves as evidenced by the news release linked above.

Anything can happen and IBB could bounce and move higher during the next session.  From a probability standpoint, the foundation of farce appears to be showing its true identity and origins.

The daily chart of IBB, is following (at this juncture) a Fibonacci projection. We’ve met and bounced off the 61.8% level. 

If the trend remains to the downside, the next projection is 100.00, then 161.80, at IBB levels (blue ovals) 120.00 and 110.00, respectively.

Note:  Posts on this site are for education purposes only.  They provide one firm’s insight on the markets.  Not investment advice.  See additional disclaimer here.

Theory vs. Action

Successful market speculators and traders, are not intellectuals.  There’s a difference between smart and savvy.

This is why scientific professionals such as doctors and engineers (author’s empirical opinion), are some of if not the worst market losers.

That statement is backed up by many sources, just two of which are below:

In Dr. Alexander’s book Come Into My Trading Room, he gives a brief reference to a Cybernetics PhD., market trader that had to ‘overcome’ his intellectual superiority to be successful.

In Market Wizards, Ed Seykota discussed a need to use his MIT Engineering degree (his intellect) in ways that won’t hurt him too badly in the marketplace.

There are now two theories on the U.S. bond market (links below) and we’ve been monitoring that market closely.  The bond action, TNX, looks like it’s about to break out with rates higher.

On Friday, we saw the market and bonds move lower together. 

The next meltdown may be a simultaneous collapse of the market and bonds.

The effect of such a move would be to wipe out retirees, the middle class and wealth management firms all at the same time.

Bond theory says, bonds will remain under control and interest rates low.  Bond action says, bonds will be sold off with rates rising.

Going to price action of the 10-year, it’s critical juncture status from the last post has not changed.  In fact, price action shows bonds even more tenuous.

Professional trading is based on price action, not theory.

At this juncture, going short (selling) the bond market (not advice) appears to be the lower risk position.

The past week has the press and public all aghast at a minor (percentage wise) blip lower. 

We’re probably on the last bubble for this cycle.  The markets could ‘air-pocket’ into several gaps lower; say, 25% – 50%, overnight.

Be Prepared

Charts by StockCharts

Note:  Posts on this site are for education purposes only.  They provide one firm’s insight on the markets.  Not investment advice.  See additional disclaimer here.

Straight-Down: Biotech

Not happening: Do not pass Go.  Do not collect $200 dollars.

From the open, IBB headed straight down; decisively penetrating support at the 130.00 – area.

Next potential support and a possible chance of a rebound, is around 125.00.  At this point, it’s not looking good.

Right now, volatility is high.

The low risk part of this move, that is, price action over the past three months, is over.

Another low-risk (short) entry point may never happen.  Biotech could just collapse from here. 

Remember, Stockman’s quote:  ‘It’s $2-Trillion of bottled air’.

Since were following the tenets set down by the market masters linked here, we’ll sit tight at this point. 

A reasonable stop level for BIS (2X, inverse ETF) can now be moved to around 33.50. For illustration only. Not a recommendation. Not financial advice.

Charts by StockCharts

Note:  Posts on this site are for education purposes only.  They provide one firm’s insight on the markets.  Not investment advice.  See additional disclaimer here.

Better Than Expected: Not Really

It’s just after the market open and there’s better than expected news on employment. That is, until you factor in temporary Census workers, skewing data to the upside. 

The Money GPS has long been providing real data and analysis (for years) on the market’s end-game.  Time stamp 7:24, at this link identifies the boost in employment numbers resulting from (Census worker’s) temporary hiring.

All this brings us back to price action.  What is the market saying about itself?

For biotech, there’s a possibility for a rise into a Fibonacci retrace level during this session. The hourly chart below, captured just three minutes after the open, shows the action thus far.

From empirical observation, IBB exhibits behavior where stop running, equalization of forces are complete around 11:30 a.m. EST. 

Depending on general market forces (S&P 500), if there’s going to be a reversal, it typically happens at (or before) that time.

If the down-trend is to continue, we’re looking for a test and reversal at either the 28.6%, or 38.2%, retrace level.

If or when that happens, it will be the trader’s discretion (not a recommendation) to either enter a short position or increase an existing position … or stand aside.

Note:  Posts on this site are for education purposes only.  They provide one firm’s insight on the markets.  Not investment advice.  See additional disclaimer here.

All But One

Of the nine market indices listed below, only one has a bearish weekly MACD cross-over:  Biotech

IYM:  Basic Materials

IBB:  Biotech

DIA:  Dow 30

IYT:  Dow transports

QQQ:  NASDAQ 100

IYR:  Real Estate

IWM:  Russell 2000

SOXX:  Semiconductors

SPY:  S&P 500

Yesterday, the indices were are at all time highs except for real estate (IYR), biotech (IBB), and Russell 2000 (IWM). 

Looking at IYR and IWM, we can see, although they are below the high, there’s still a persistent up-trend.

Even with today’s on-going reversal (three-hours before close), only biotech has posted a bearish, weekly MACD cross-over.

Of course, it won’t be known until after the fact why biotech is unique.  A hint at what might be the reason, is here (if it’s still available).

A gallery of the weekly index charts, listed above (as of 9/2/20) can be found here.

The focus of this firm, since June 3rd, exactly three months ago, has been biotech and its impending reversal.

A significant short position has been established over those three months via BIS, the 2X, inverse fund. Current Stop: 32.18

So, just what is ‘significant’?  How big is that?

To be transparent, without giving specifics, avoiding the usual internet keyboard warrior, and/or hater, the position is as follows:

We’re short what amounts to a full year’s wage for the typical American worker.  Fair enough?

When the position is closed out, results will be posted on the company site, located here.

Note:  Posts on this site are for education purposes only.  They provide one firm’s insight on the markets.  Not investment advice.  See additional disclaimer here.

Ten-Thousand: True or False?

That’s right.  Only 10,000 people in the U.S. have actually died of the ‘speck’ as the single mitigating factor.  True, or False.

shutterstock_26779105For those working the biotech sector,  it doesn’t matter.  Price action will decide.

This firm, is heavily short biotech for many reasons other than a potential (and likely) world-wide hoax.

We’re already expecting biotech to vaporize in a reversal and melt-down. 

Of course, if it turns out it really is the biggest hoax ever, how’s that going to affect all the biotech firms rapidly working on a cure for the common cold?

If the truth comes out all the pent up ‘investor’ demand for (or hopes to profit on) an injection are false, one could expect ‘vaporize’ to go ‘nuclear’ as everyone rushes for the exit.

Biotech price action shows it’s in a down channel. 

Yesterday’s session hit the upper channel line.  At the same time, it retraced a Fibonacci 38%, of the entire down move that began in July.

Today’s session was decisively lower. Price action posted a low below yesterday’s low (bearish).  In addition, IBB closed within the previous trading range; also bearish.

2020-09-01_15-15-55-IBB-Daily-4-bar-notes


Charts by StockCharts

Note:  Posts on this site are for education purposes only.  They provide one firm’s insight on the markets.  Not investment advice.  See additional disclaimer here.