Gold Top?

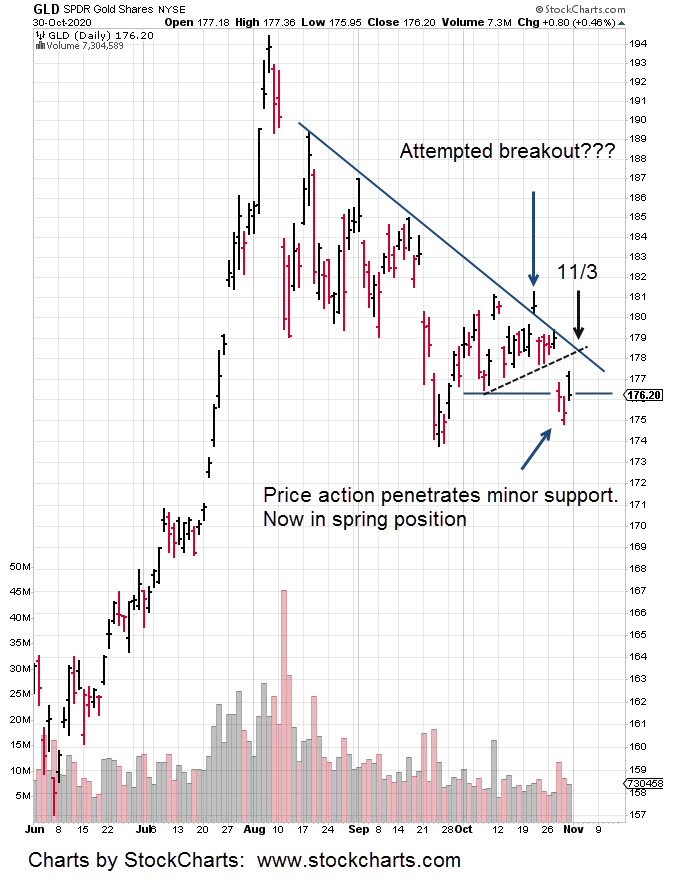
Gold has made at least three attempts to post a new weekly (GLD) high.

Now, price action is fading.

Penetrating last week’s high of 179.43, would put GLD on track to continue on to the 181.50 – area.

At this juncture, we’re at 178.84, after three attempts to penetrate that 179.43 level.  Those attempts topped out at 179.04, 179.10, 179.18 and then 179.18 (again), when looking at the 15-minute chart.

That last attempt could not push higher.  We may be finished and pivoting lower.

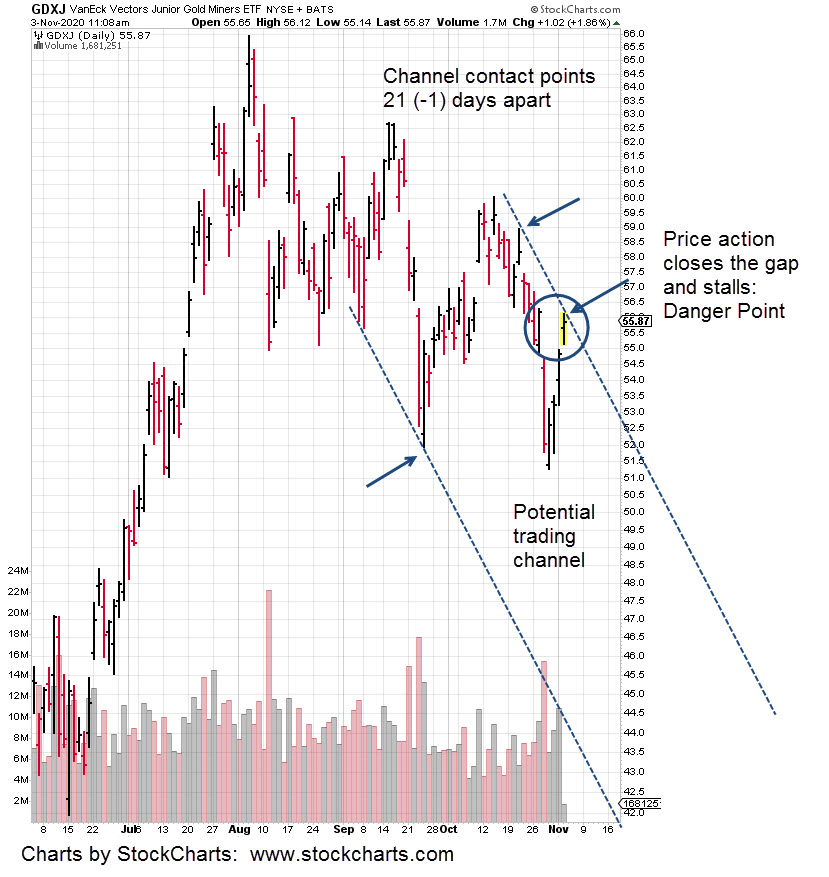
From the Junior Miners, GDXJ standpoint (chart above), we have what looks like a gap-fill; along with establishing a down-trend and possible trading channel.

It’s never obvious until it’s over.

At this juncture (11:41 a.m. EST) JDST, the 2X Inverse Fund is hovering around 10.60 – 10.64, just above its lows for the session.

Once again, taking all factors into account; the position of GLD, not making a new weekly high, GDXJ filling the gap and then appearing to stall, a potential trend-line and channel; all ties up to be a low risk area (not a recommendation, not advice), the danger point.

Once caveat is GDXJ is not at any well established Fibonacci retracement level.  Price action could grind itself higher into the 56.60 area, no matter what gold (GLD) is doing.

Charts by StockCharts

Note:  Posts on this site are for education purposes only.  They provide one firm’s insight on the markets.  Not investment advice.  See additional disclaimer here.

Before The Open

As expected from the November 1st, update, gold pre-market shows a gap-higher open.   Trading is around 178.80 – 179.00 which is a little above the resistance area shown in the original chart.

After the first hour of trading, the plan is to provide an update to see if there’s still a possibility of a reversal at this juncture (not advice, not a recommendation).

Correspondingly, the mining sectors, GDX, GDXJ are up in pre-market with inverse DUST and JDST, down. 

However, the big hitter, NEM is right at a 50% retrace off the lows of October 28th.  This is a possible area to stall and potentially resume a downward (or sideways) trend.

Other market actions that may have significant impact on silver/gold, are the four-standard deviation in the bonds to the short side.

As Steven Van Metre indicates, none of us reading this (in our lifetimes) are likely to ever see a set-up like this again.  It’s an historic extreme.

Bonds are down in pre-market along with the dollar … using UUP as the proxy.

The dollar has bottomed and is now in position to rally; completely opposite the established consensus.

At least twice now, Van Metre has mentioned Wyckoff in his updates.  He appears to be well aware of the significance.

In other markets, a position was opened in nat-gas, UNG at the last session.  That position was closed in the pre-market session with a slight ding of -1.2% to the managed account.

Even with record cold hitting large portions of the country, nat-gas can’t seem to get going to the upside.  Now, with its current action there may be a probability of lower prices (or stagnant action) going into winter.

We are leaving nat-gas alone for now and focusing on the historic bond set up and the potential effects when it all unravels.

Note:  Posts on this site are for education purposes only.  They provide one firm’s insight on the markets.  Not investment advice.  See additional disclaimer here.

Before The Open

Gold is set to open higher as expected.  Corn is set to open lower … not expected and nat-gas looks like it will test its trend-line.

The only position currently open is CORN. 

Lower CORN open in the works, crop report due at the upcoming close and price action hugging the lows. We’re at the danger point three days in a row; planning to exit CORN (not a recommendation, not advice).

Taking the markets on the watch list into account, the opportunity appears to be nat-gas, UNG.

If price action contacts the trend-line and begins to pull away, there is a potential confirmation and trade set-up.

Charts by StockCharts

Note:  Posts on this site are for education purposes only.  They provide one firm’s insight on the markets.  Not investment advice.  See additional disclaimer here.

Gold: Short Term Forecast

Gold (GLD) may rise slightly into the election … then pivot down.

If gold and silver are the safe havens, why have they not moved higher as the overall market has declined?

Years ago, literally decades ago, Robert Prechter proposed ‘it’s all the same market’.  Meaning, everything is connected and nothing moves independent.

Sufficient evidence has been proposed on this site, that potential exists for deflation first, then inflation.

Continuing on with Prechter, he states that any significant directional move (major reversal) won’t happen until nearly every market participant is on the wrong side of the trade.

It’s easy to see who is on the (potential) wrong side of the trade for gold and silver.  Just one glance at YouTube reveals hoards, buying into the hyperinflation argument.

Sometimes the hoard is correct … but not very often.

Getting back to gold and GLD.  An expandable version of the chart is here.

Price action penetrated minor support and generated a Wyckoff spring condition.

This past Friday’s action opened gap-higher and declined to test the support level.

The expectation is for higher action into the election. 

How price behaves at the trend-lines shown (if and when contact is made) will indicate whether or not it’s in position to reverse lower or head higher to the 180 – 181, area.

Price action itself decides the next likely course.

Should there be a reversal, there are numerous ways to position (not a recommendation, not advice) for a decline.  Inverse funds DUST, JDST, and ZSL are just a few vehicles available.

Charts by StockCharts

Note:  Posts on this site are for education purposes only.  They provide one firm’s insight on the markets.  Not investment advice.  See additional disclaimer here.