The table lists well known index ETF’s; along with most recent highs and current (Friday) close:
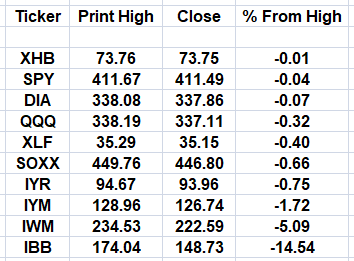
All the usual suspects are there:
S&P 500, SPY, The Dow 30, DIA, Nasdaq, QQQ, and on.
What’s also listed is how far each index (ETF) is from its most recent all time high or ‘recovery’ high (in percentage terms).
Obviously, one of these is completely out of bed: Biotech, IBB
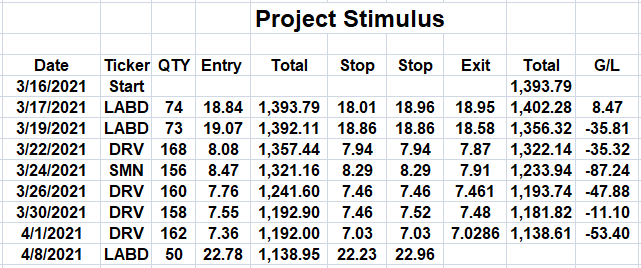
We’ll be discussing the technical condition of biotech tomorrow. For now, the updated ‘project’ chart’s included below:
Note: Posts on this site are for education purposes only. They provide one firm’s insight on the markets. Not investment advice. See additional disclaimer here.

Pingback: Biotech … Down, Down, Down « The Danger Point
Pingback: Pre-Market « The Danger Point