Note: Posts on this site are for education purposes only. They provide one firm’s insight on the markets. Not investment advice. See additional disclaimer here.
Note: Posts on this site are for education purposes only. They provide one firm’s insight on the markets. Not investment advice. See additional disclaimer here.
We’re going to use the chart from yesterday’s post to set the stage for getting closer-in.
This past Friday’s early morning ‘spike’ is barely visible; the 30-minute (inverted) chart below, has more detail.
SPBIO, 30-minute (Inverted)
Price action rejected the lower levels (higher on SPBIO) and pulled away throughout the session. That ‘pulling away’ continued on, all the way into the close.
That’s a clue there may be follow-through at the next session.
If the early session opens ‘gap-higher’ (SPBIO, lower), into the resistance area (four magenta arrows, hourly chart), it would be the fourth time pressuring at this area; markets rarely hold a fourth attempt.
Summary
Of course, other markets are being watched like real estate (IYR), Tesla (TSLA), and even Basic Materials (DJUSBM), a potential sleeper for significant downside.
Updates are planned if/when low risk shows up.
Positions: Current Stance (courtesy only, not advice).
The following is the positioning of my firm’s main (largest) account.
Note: Posts on this site are for education purposes only. They provide one firm’s insight on the markets. Not investment advice. See additional disclaimer here.
With the CPI just released, the article at this link says, ‘the Fed’s work isn’t over.’
They’re so right; but it’s not the work they (at MarketWatch) think it is.
We should all know by now, the truth is right in our faces, but we have to be able to ‘see’.
What was seen yesterday, was that biotech appeared to be reaching an extreme.
As a result of the price action, a change was made in positioning out of (Basic Materials short) SMN and into a biotech short via LABD (not advice, not a recommendation).
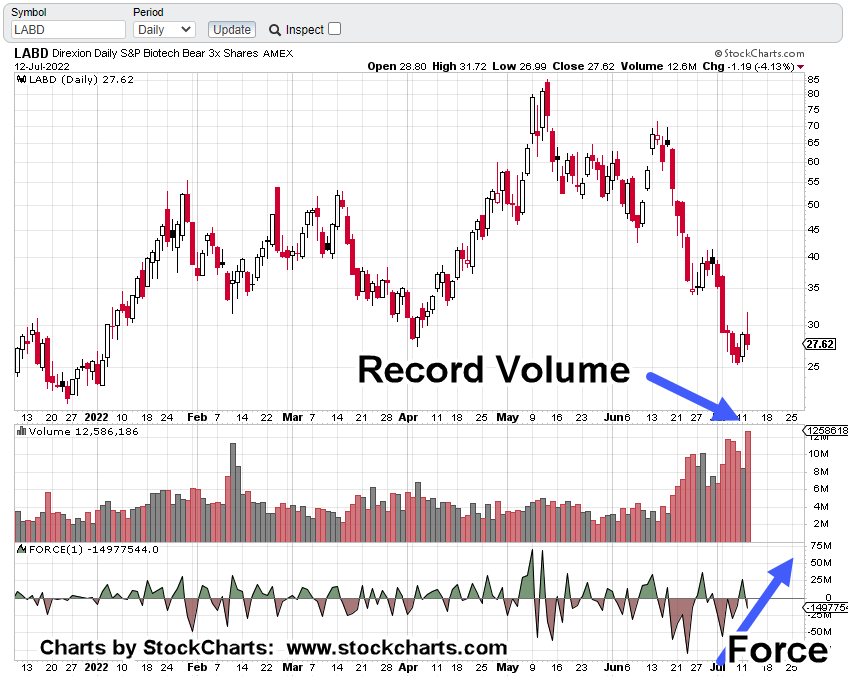
Part of the reason to focus on LABD was the record volume as shown on the chart below.
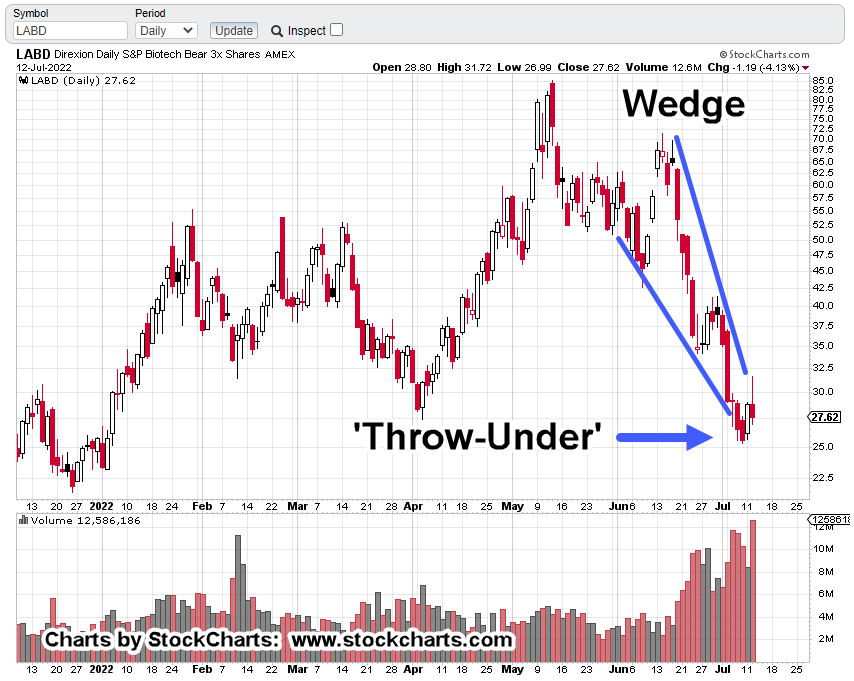
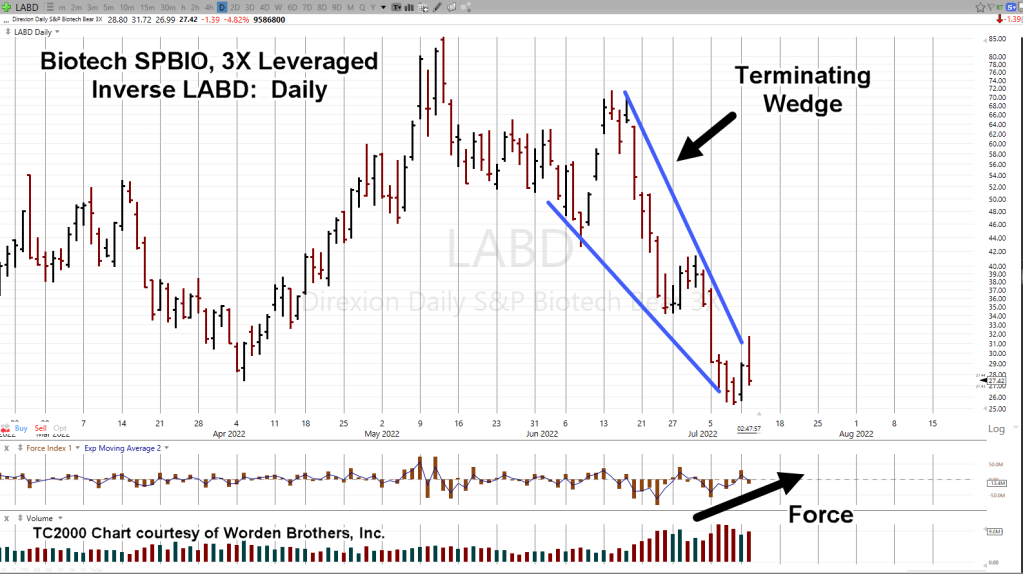
Biotech 3X, Leveraged Inverse LABD, Daily
Note how the Force Index shows downward thrust energy is dissipating … even with the record down volume.
Next, we have the terminating wedge formation; indicating a potential reversal is at hand.
A wedge formation is a typical signal for an up-coming (potential) reversal.
It occurs at the tail-end of a sustained move; meaning a wedge is the last pattern to be formed. Sometimes there’s a throw-over (or under) and sometimes not.
Either way, it’s the end of the directional move.
After The Open
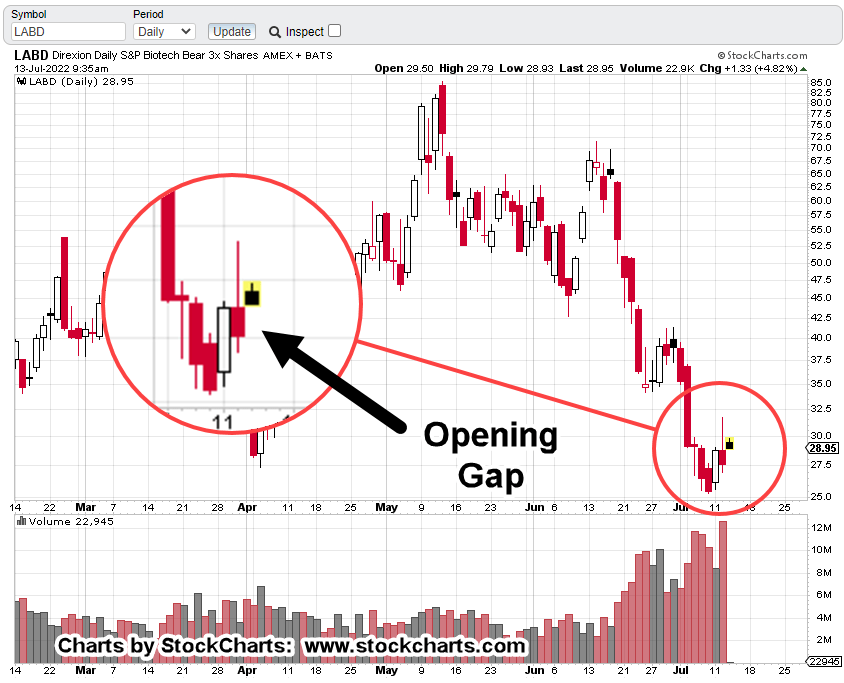
We’re just after the open; this is how it looks for LABD.
The first order of business is usually an attempt to close the gap.
As with the prior set-up in YANG, linked here, the objective is to allow LABD, close the gap as much as possible before adding to the existing position, LABD-22-05 (not advice, not a recommendation).
That may happen or not. This market’s already at a pivot extreme.
Note: Posts on this site are for education purposes only. They provide one firm’s insight on the markets. Not investment advice. See additional disclaimer here.
At this link she explains to the kindergarteners (who even at this late stage, STILL believe the lie), the truth about ‘The Speck’.
Go to time stamp 6:37 and watch; you can clearly see her exasperation as she has to go through it one more time.
We also have this going on behind the scenes as well.
On the other side is the continuous stream of fear propaganda. Just go to your local TAAS (sorry, FOX) news outlet to hear the latest lie du jour.
With that in mind, let’s go straight to the index for the day, biotech SPBIO.
The last analysis proved to be flat wrong.
There was a breakdown as anticipated but that move did not follow through. It was the precursor to an up-leg which is where we are now.
Biotech SPBIO, Weekly Close
It’s obvious.
Last week was a test of the resistance (blue line).
Thís week started with biotech sharply lower (early today) but then coming back to test … where we are now.
That test is starting to reverse late in the session (around 3:00 p.m. EST).
Let’s go straight to the inverse fund LABD
SPBIO 3X Leveraged Inverse LABD, Daily
A very tight wedge has formed.
Price action attempted to break out but has come back for a test. This is where risk is least (not advice, not a recommendation).
Positioning
The Basic Materials short (SMN-22-01), while profitable, was not going as planned. That position was exited at SMN 14.29 … you can see it as the low of this session on your trading platform.
SMN 14.29, is me 🙂
That capital has now been used to position short biotech, SPBIO at LABD 27.58. trade LABD-22-05 (not advice, not a recommendation).
The current stop is the low of the day @ 26.98.
Summary
Even as this post is being generated LABD is pulling away from the lows. With about one hour left in the session, it’s at 28.18.
The LABD entry was an initial position; there’s plenty of capital left to increase the line if trade conditions warrant.
Note: Posts on this site are for education purposes only. They provide one firm’s insight on the markets. Not investment advice. See additional disclaimer here.
From a strategy standpoint, we’re now ready for the next round of financial destruction.
If we use this article from ZeroHedge, as the pivot point, consumer credit has maxed out.
The consumer (i.e., middle class) is now on the downward slope, just as the layoffs are about to begin in earnest.
Following the typical corporate model, expect job losses (time stamp 15:18) to start slow, then accelerate into December of this year.
The latest employment numbers provide the perfect backdrop to raise interest rates into a declining economy; all going as planned.
Market Response
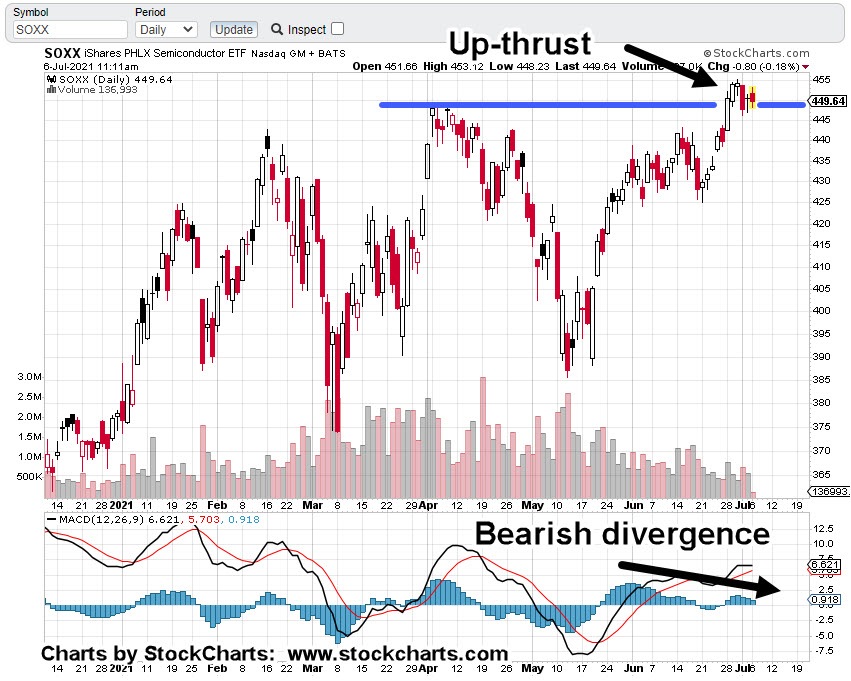
As is typical, everyone’s focused on the major indices; The S&P 500, Dow, NASDAQ, SOXX, and on.
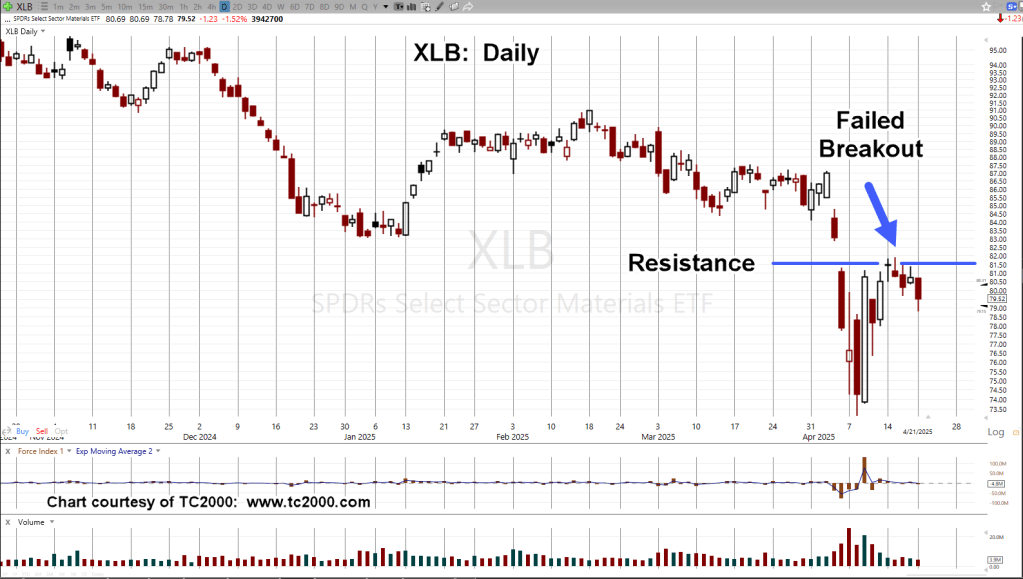
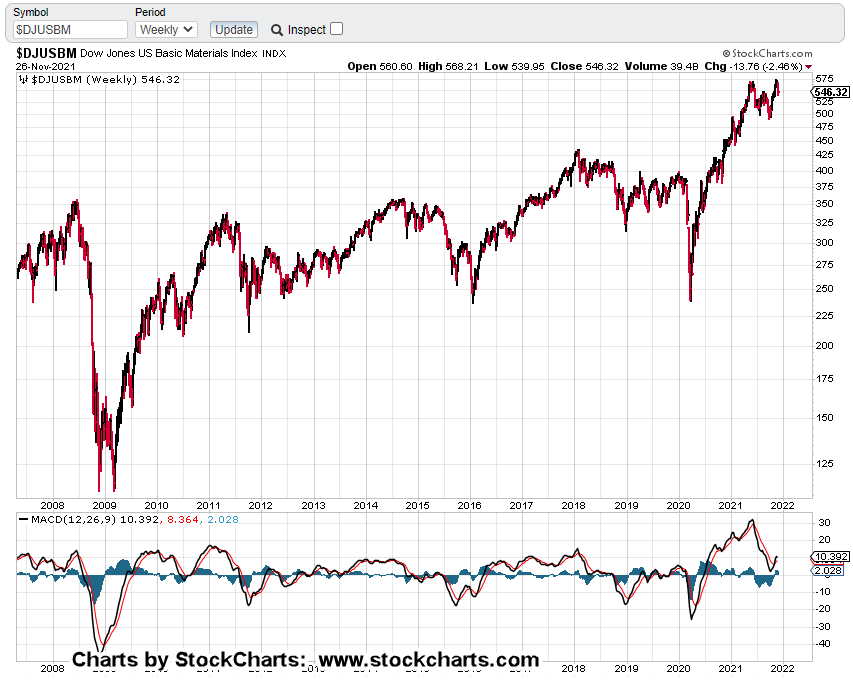
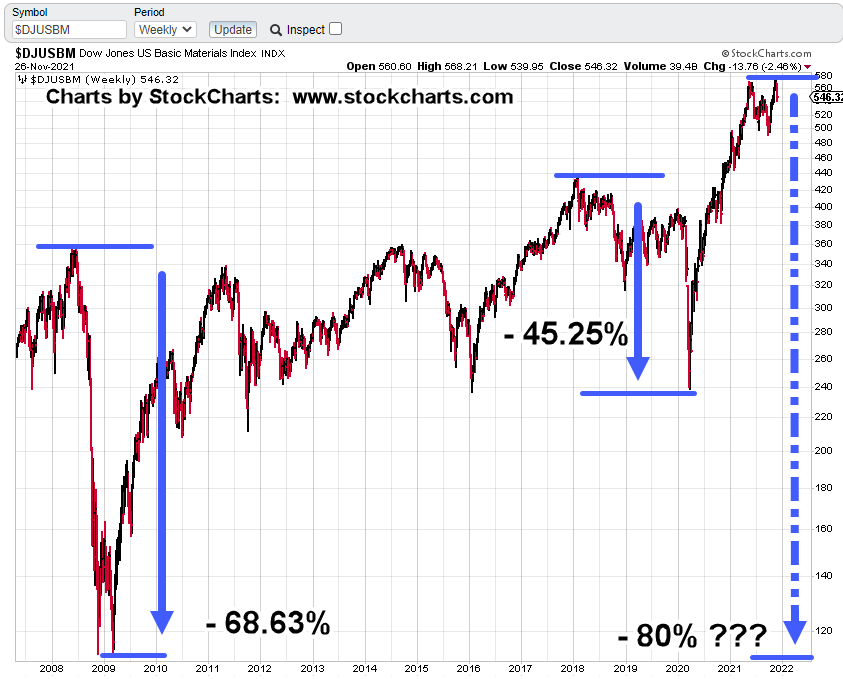
However, there’s one sector covered in the past, that’s mostly ignored: Basic Materials, with ticker DJUSBM.
That sector has held up until recently; probably because the thinking was, we’re going to have infrastructure projects to keep the economy going.
Looks like someone got the memo; Basic Materials has broken down.
As of this past Friday, it’s at a critical point.
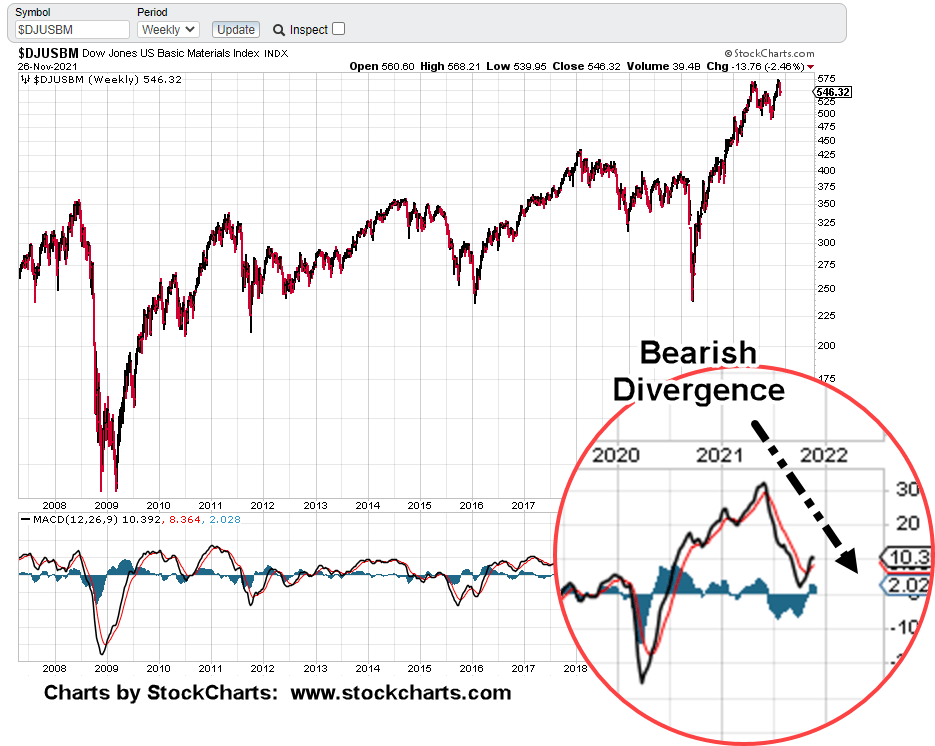
The prior post from last November, does an excellent job of highlighting the divergences (which have only become worse) as well as downside potential.
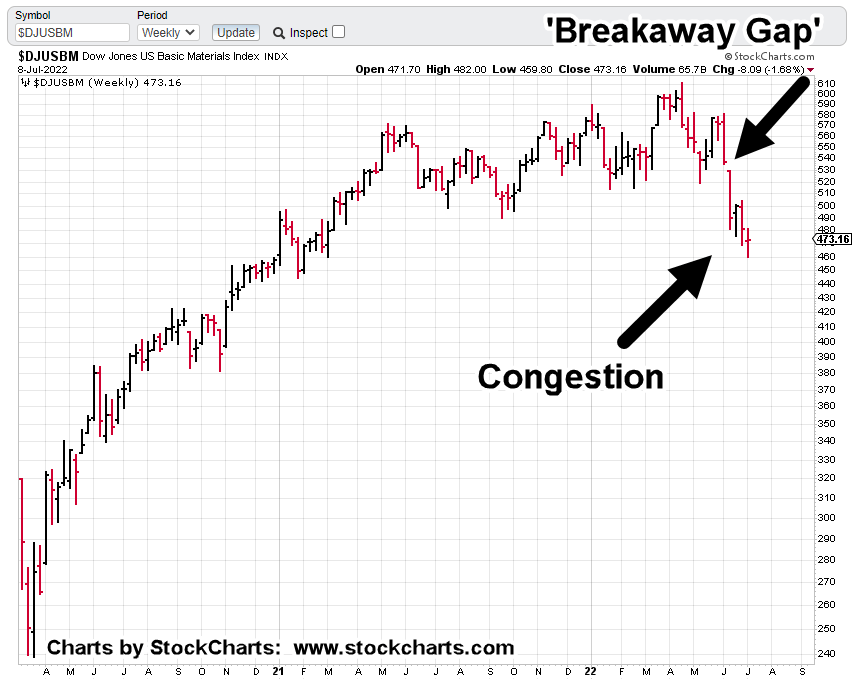
Basic Materials DJUSBM, Weekly
On the chart, we’ve got a breakaway gap that looks like it won’t be filled.
After that break, price action has formed a congestion area over the past three weeks.
However, it’s the congestion area giving us clues; the sector’s set up for an imminent break to the downside.
If that congestion holds true, it’s a stunning revelation of what may be about to happen.
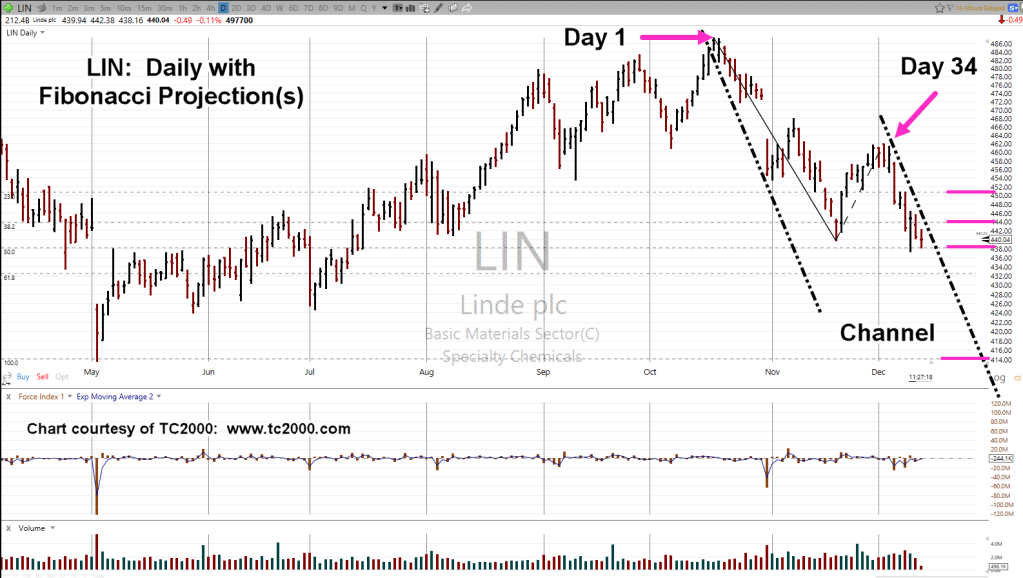
We’ll go to the daily chart and start with a Fibonacci time correlation between pivot points.
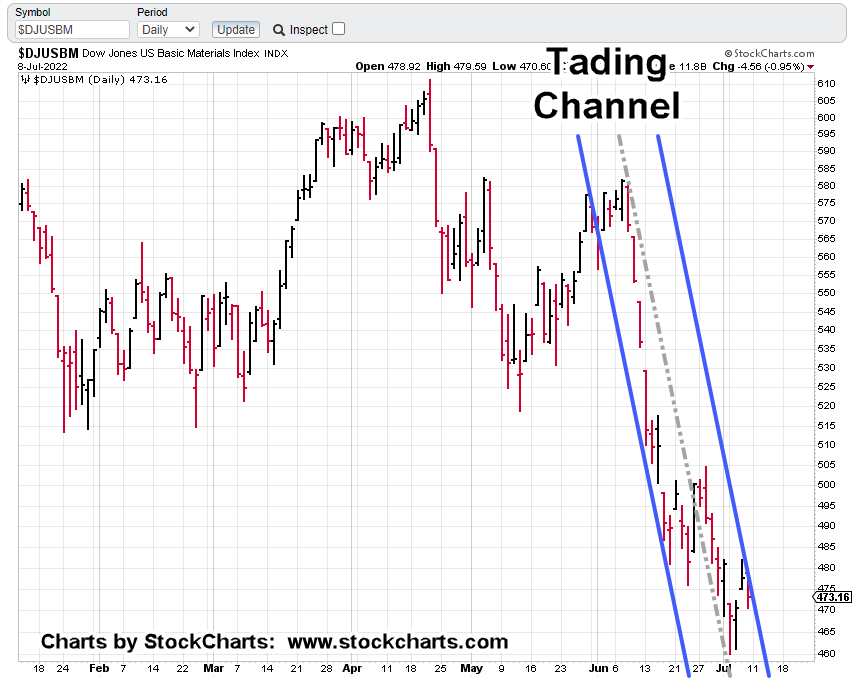
Basic Materials DJUSBM, Daily
Well, it might not look like much.
However, let’s go one step further with another time correlation, shown below.
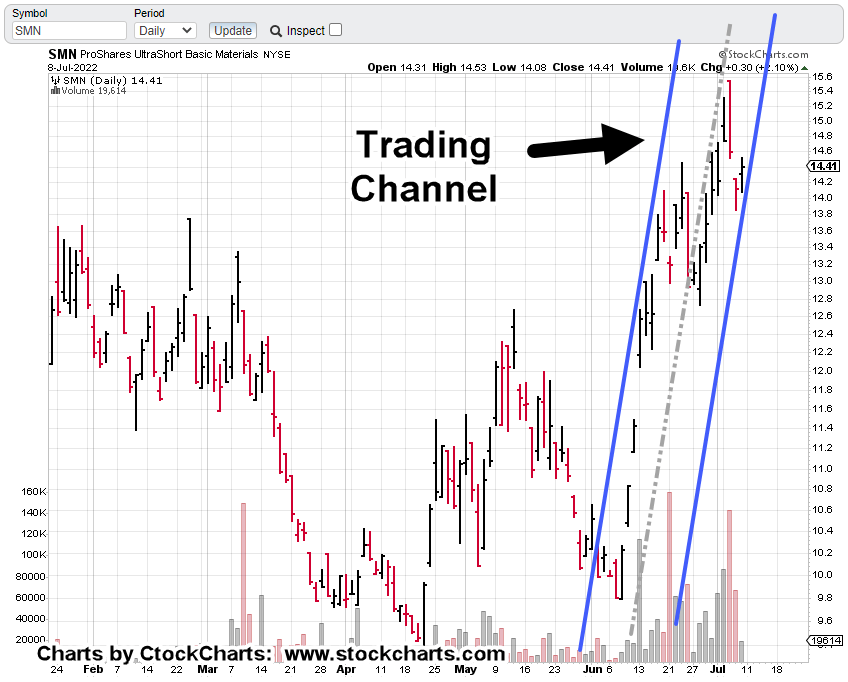
If you’re reading ahead, then you already know a trading channel has been defined.
The next chart shows the result.
For this channel to confirm Fibonacci ‘Day 21’, Friday’s action had to post lower … and it did.
That lower action also confirms, the channel’s a Fibonacci 13-Days wide.
Even more disconcerting (depending on one’s viewpoint), the channel lines are declining at approximately – 96.5%, on an annualized basis.
It’s not straight down but it’s close.
The next chart has a zoom of the congestion area.
Note how the grey dashed ‘center line’ is perfect in its contact points … further confirmation of the channel.
Leveraged 2X Inverse SMN, Daily
Although volume is still light, it has improved dramatically.
On a weekly basis, last week was the second largest trading volume at least going back to the ’07 – ’08, meltdown.
The inverse fund is shown below with the trading channel.
Liquidity is still marginal but has picked up over the last three weeks.
The Week Ahead
Obviously, the expectation for the next open is to post lower for basic materials.
Even with all the analysis, it’s the market itself that’s the final arbiter.
Positioning
As the hyperlink tabs in this post (top-left) show, I’ve positioned one account short the sector via SMN (SMN-22-01), with a stop just below Friday’s SMN, low at around SMN 14.05 (not advice, not a recommendation).
It’s a very tight stop.
The analysis is either in-effect, or it’s not. By this Monday, we’ll find out.
A Decline of Biblical Proportion.
On a strategic basis, we can see how expertly the middle class has been maneuvered into a corner.
For the past two years and probably much longer, that sector has been positioned to not have any recourse when the real decline hits.
We may be there now.
At the same time, if you’re up on Biblical references, you already know that when destruction came, there was always a ‘remnant‘.
The remnant was left to either escape or re-build and was typically 10% of the population.
If you’re reading this, you have already decided at some level, to be part of that remnant.
Note: Posts on this site are for education purposes only. They provide one firm’s insight on the markets. Not investment advice. See additional disclaimer here.
The Danger Point®, trade mark: No. 6,505,279
Active: Short DJUSBM via SMN, as SMN-22-01, stop @ SMN 14.05
If you have to deal with asleep, brain-dead, self-hypnotized, condescending, mainstream news-feeders, here’s a tip.
Remember, it’s not “your opinion”.
Patent numbers, patent descriptions, dates, names, payrolls, money trails, corporations, whistleblower testimonies, irrefutable compilations like this, are not an opinion.
They are fact.
No. 2
No Infrastructure
From time stamp 12:08, to 14:27, in the above link (repeated here), there are 108, players or individuals receiving the benefits of ‘Speck’ protection.
We call it The Speck from Horton Hears A Who … because it’s so small, nobody’s ever found one; not even the Cee Dee Cee or the N ‘EYE’ H. Sorry for the ‘code’.
The majority of those in the compilation are so protected, they won’t ever need another update.
You might say, they’re ‘fully protected’.
We can take that montage and extrapolate it to the rest of the population. Remember this?
It does not take much to figure out, rapidly increasing instability is the way forward.
While there may be an infrastructure bill in name … if workers are not available and supplies restricted or non-existent, there’s no infrastructure.
Admittedly, that’s very oversimplified.
Sure, there may be some projects that get started and have limited progress.
However, after reading this summary of the built-in insanity, one really has to actually be favoring a collapse so these projects don’t get implemented to any large degree.
Bringing us to the next item.
No. 3
Double-Secret-Probation, ‘Omicron’
It would be nice to laugh at stupidity if stupidity wasn’t so dangerous.
The powers are wasting no time … declaring a ‘State of Emergency’ even though nothing has happened.
They openly mock the idiots that still buy into the hype; their contempt, completely out in the open.
Even a working-class Cockney Brit, has got it figured out. It can’t be that hard, can it?
Note at time stamp 2:40, it shows that we may have already had the Epsilon variant. It must have come and gone.
I completely missed it. My bad. 🙂
No. 4
The Sheep … Too Far Gone
A hopeful comment taken at time stamp 4:02, at this link:
Those who have bought in, and voluntarily injected themselves … even if they were lucky enough to get a placebo, will not wake up.
Amadha Vollmer has stated it well when she said, ‘when the truth finally hits, they will lose their minds.’
From a Biblical standpoint, that does not mean we give up on them. Plant the seed but then walk away and continue to prepare.
If by some miracle … because that’s what it would have to be, they do wake up, it’s your opportunity to take the lead and direct their (an your) next steps.
You can’t make this up and it’s more insane by the day.
The sheer repetition of the fear narrative, like ever-increasing drug use for the same effect, has got to be wearing off … becoming less effective with each news release.
On top of that, there are literally less people able to buy into the narrative
Reference No 1, above. They have already received full protection; not subject to further updates.
No. 6
Sky High Ammo Prices
Going to the comment sections on YouTube sites or vendor sites, has the typical collection of blowhards saying:
“I refuse to pay these prices. I’m going to wait until they come down”.
It’s possible, at least some of these guys are the same middle-aged, overweight, out-of-shape posers, that like to have useless crap all over their AR.
When the bravest guy in the room is a woman (linked here), it means, that trash hanging off your AR is a bill-board; effectively saying:
‘I’m hiding behind my AR crap and probably a coward’.
Another woman, linked here, has actually decided to use the AR platform.
If that’s the future availability of our currently high-priced product, meaning there is none, does it really matter how much it costs now?
Of course, the posers are busy posing.
They won’t matter when it all hits. They’ll still be waiting for prices to come down on something that’s no longer there.
No. 7
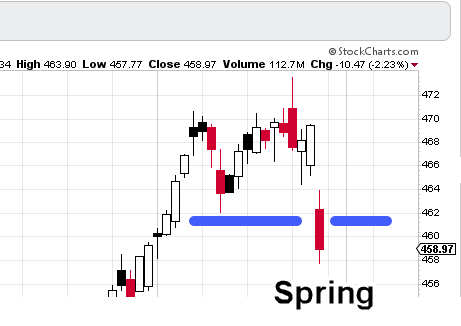
S&P, In ‘Spring Position’
Price action penetrated support last week and is set to attempt a rally.
The futures market opened about 90-minutes ago and shows S&P trading up about +0.80%.
That upward bias may also lift the Basic Materials Sector (DJUSBM) and possibly offer a low risk short position via SMN (not advice, not a recommendation)
Note: Posts on this site are for education purposes only. They provide one firm’s insight on the markets. Not investment advice. See additional disclaimer here.
However, this fund is not like inverse ETFs; SDS, DXD, SOXS, QID, DUST, and so on.
Basic Materials is not ‘popular’. At least, not yet.
That means the fund is illiquid with larger spreads (bid/ask). In addition, it takes a good few minutes after each open for those spreads to calm down and narrow up.
It’s not for the inexperienced.
Summary:
As we’ll get into tomorrow, ‘normal’, is gone.
There’s not going to be ‘normal’ (a personal opinion) in the lifetimes of anyone reading these updates.
That doesn’t mean there are no opportunities.
Basic Materials, DJUSBM, is about to, or already has (potentially) started its downside reversal.
Note: Posts on this site are for education purposes only. They provide one firm’s insight on the markets. Not investment advice. See additional disclaimer here.
Three markets with key reversals and the biotech sector (SPBIO) posting an inside day.
One other (less followed) market of note with outside down, was basic materials (DJUSBM).
Gold’s (GLD) upward thrust from Thursday the 29th, continues to erode.
One gets the sense that it’s slipping away for the bulls.
SPBIO price action shows the most probable direction is lower.
Expectation for the next session, is for some kind of downside follow-through along with lower market action overall.
Positions:
Current positioning remains unchanged (not advice, not a recommendation) being short the biotech sector via LABD.
Market updates for the week will be limited (as the result of travel) and will resume with technical discussions by the week-end.
Stay Tuned
Note: Posts on this site are for education purposes only. They provide one firm’s insight on the markets. Not investment advice. See additional disclaimer here.
Note: Posts on this site are for education purposes only. They provide one firm’s insight on the markets. Not investment advice. See additional disclaimer here.