Any Buying Support Left ?

Not if you look at the volume profile.
Steven Van Metre, in his Sunday Night Charts (time stamp 12:20), shows the precarious situation of GDX.
There’re about 90-minutes left to go in this session.
It looks like GDX is/has tested underside resistance and down-trend simultaneously. For GDX to break higher, it would have to get through that resistance.
As always, anything can happen but we need to remind ourselves, the gold bulls are already trapped … having bought at the mid-November breakout.
If still holding, they’re now deep in the red.
Under such conditions, each down move serves to set the (bear) hook even more.
If we use this just released article from ZeroHedge, we’re nowhere near any kind of capitulation and upside reversal.
Senior Miners, GDX
The un-marked daily chart
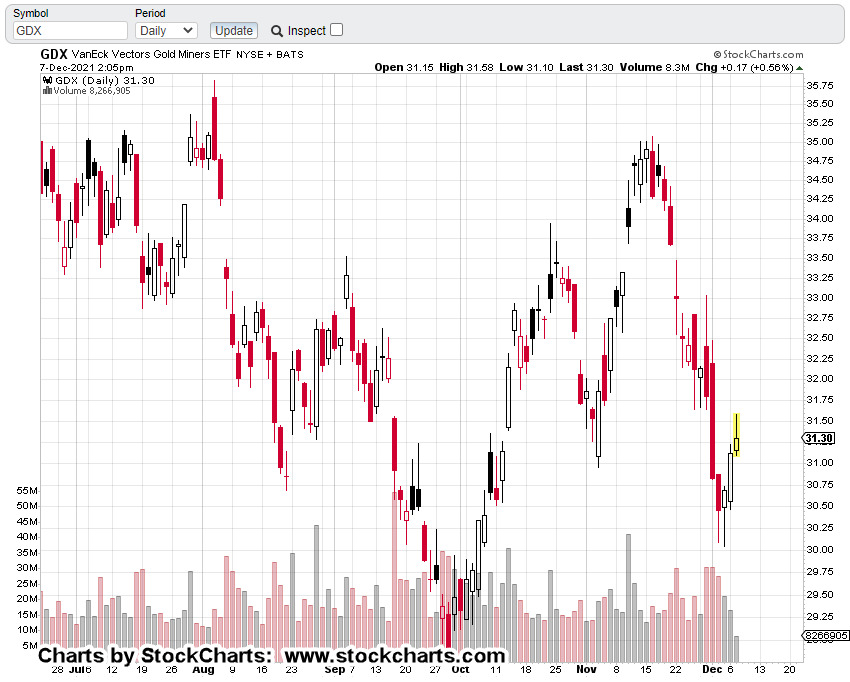
And now …

With zoom

We’re at a confluence of resistance; the downtrend and the underside of price action.
Let’s keep in mind, the overall markets (S&P, Dow, Nasdaq) are still oscillating around their all-time highs. Volatility has increased as the trend appears to be changing.
Gold and the miners are nowhere near all-time highs.
A century ago, Wyckoff showed how to spot markets that would decline the fastest and farthest under bear market conditions (not advice, not a recommendation).
It’s not the high-flyer we’re looking for … no, it’s the laggard.
That’s the one to pick.
It’s already weak and once the buoyancy of the general market evaporates, the bottom may fall out.
Stay Tuned
Charts by StockCharts
Note: Posts on this site are for education purposes only. They provide one firm’s insight on the markets. Not investment advice. See additional disclaimer here.
The Danger Point®, trade mark: No. 6,505,279
