Last Session’s Record Volume
Depending on today’s action, yesterday may have been a ‘changing of hands’ for biotech; specifically, the leveraged inverse fund LABD.
We’ll start first with the longer time frame; the weekly, to show that SPBIO is at or near a Fibonacci 23.6% retrace.
Biotech SPBIO, Weekly

Looking just to the left of the right-side action we see a significant congestion area that’s highlighted below.
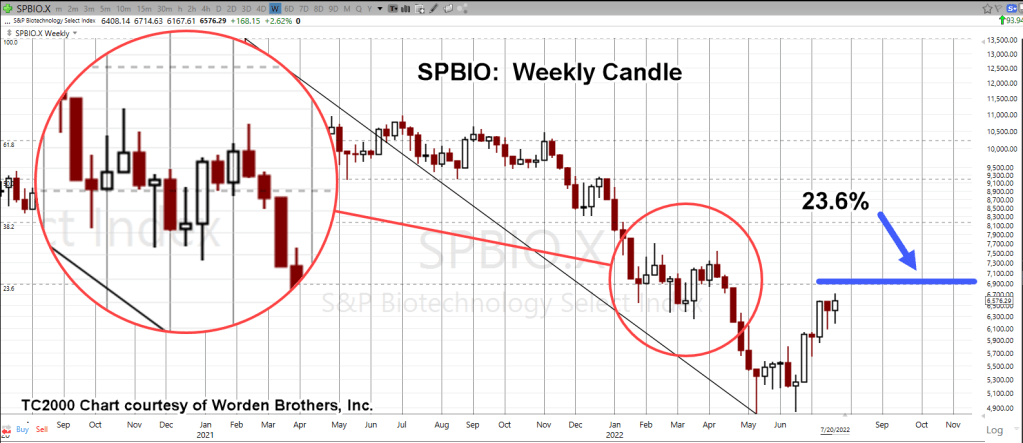
Note how price action has oscillated around that area.
It’s about three-months at this level before breaking lower and now, coming back to test.
The resistance is significant.
Next, is the inverse fund’s daily chart and the record volume.
SPBIO Leveraged Inverse LABD, Daily
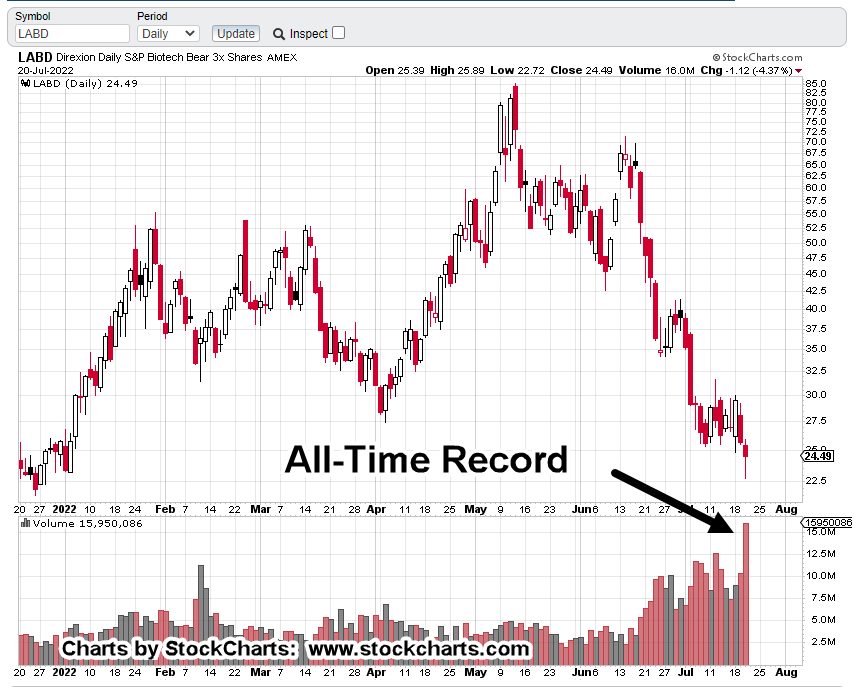
Depending on today’s action, this is a potential ‘changing of hands’ from weak to strong.
We saw that such volume in the gold market (GLD) was indeed an infection point.
Concerning gold (GLD), back on March 20th, the report linked here, had this to say:
“From a Wyckoff, tape-reading approach, we have to trust what the chart is telling us.
That is, gold has reversed.”
How true that was. GLD never looked back and is now down around – 18%, from its highs.
The same could be happening for biotech.
Stay Tuned
Charts by StockCharts
Note: Posts on this site are for education purposes only. They provide one firm’s insight on the markets. Not investment advice. See additional disclaimer here.
The Danger Point®, trade mark: No. 6,505,279

Pingback: Biotech, Test-In-Progress « The Danger Point®