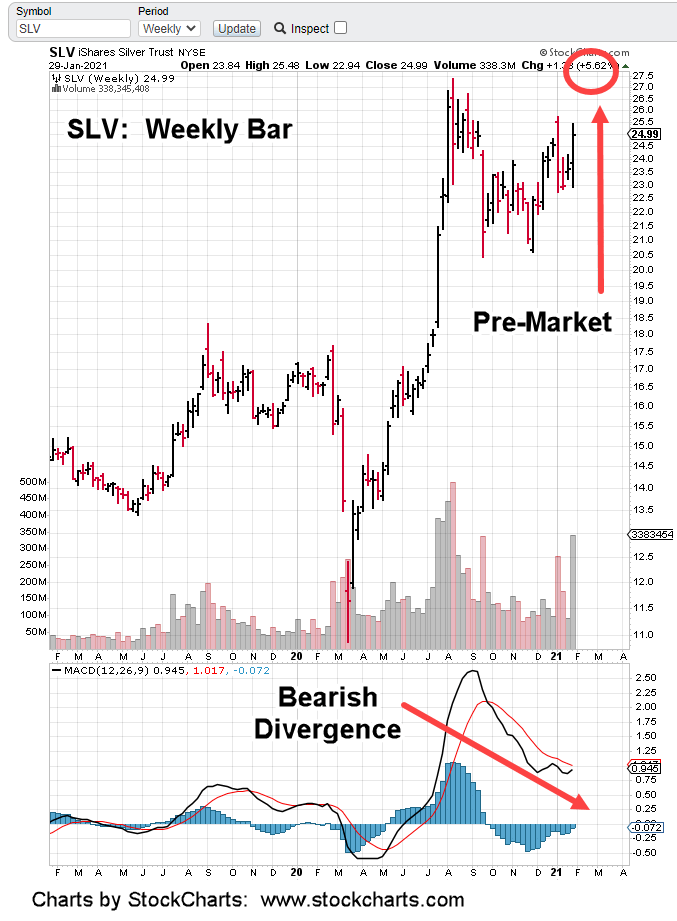
The silver hype couldn’t even last for a single day.
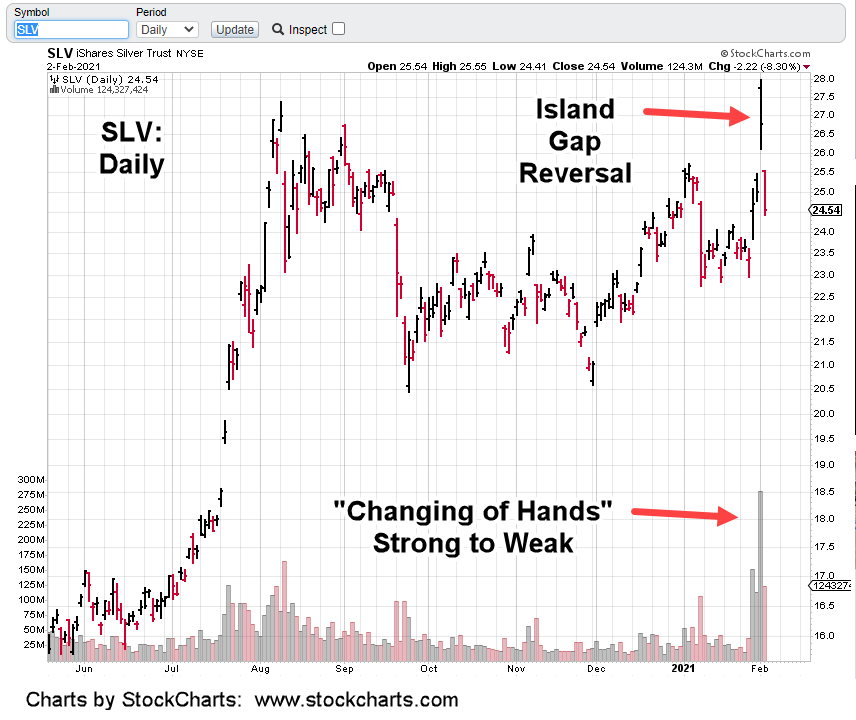
Price opened gap-higher on Monday and then steadily eroded to close lower; posting a reversal bar on massive volume.
The next day, yesterday, the trap is shut. Island gap reversal.
Way back in Livermore’s time, in his (fictionalized) biography, he says the big players can’t get in and out whenever they want.
Their positions are so large, entering and exiting would cause huge moves in the market. They need to have an “event” with massive volume so as to hide their actions (entering or exiting).
The pre-market update on Monday proposed the whole kabuki theater with GME, then SLV could have just been a ruse for big players to establish massive SLV (or futures) short positions; or just plain exit out entirely.
That idea doesn’t sound so far fetched now.
We’ll have to see if it’s true at the next commitment of trader’s report.
Either way, it’s not really important to dive into the minutiae. We can just look at the chart.
As Prechter likes to call it, massive volume signifies a “changing of hands”. Most likely from strong to weak (i.e. from professional to retail).
The significance probably invisible to the public, this may be the inflection point.
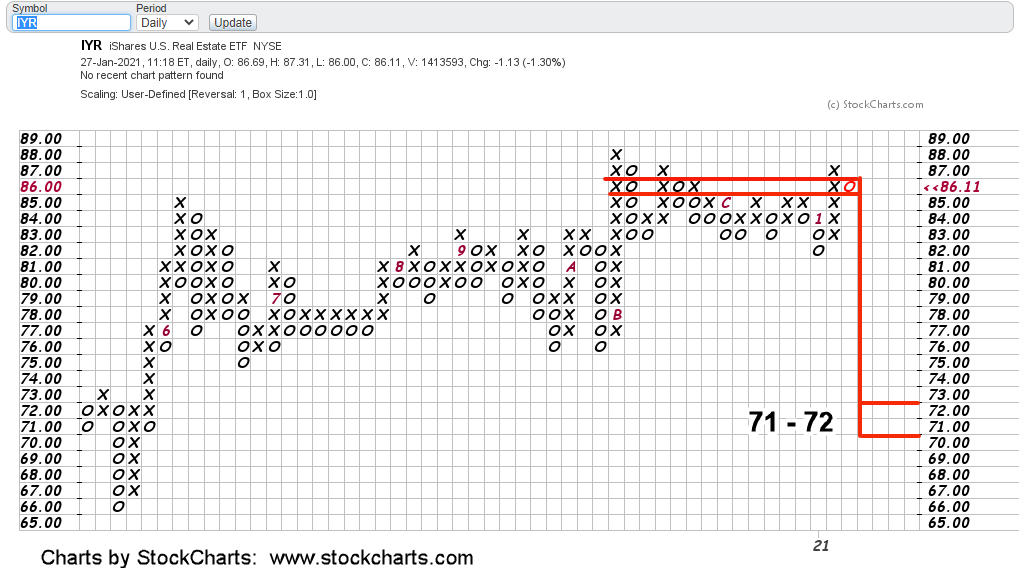
Now that SLV’s at a potential long term pivot, we could be at the cusp of a deflation impulse.
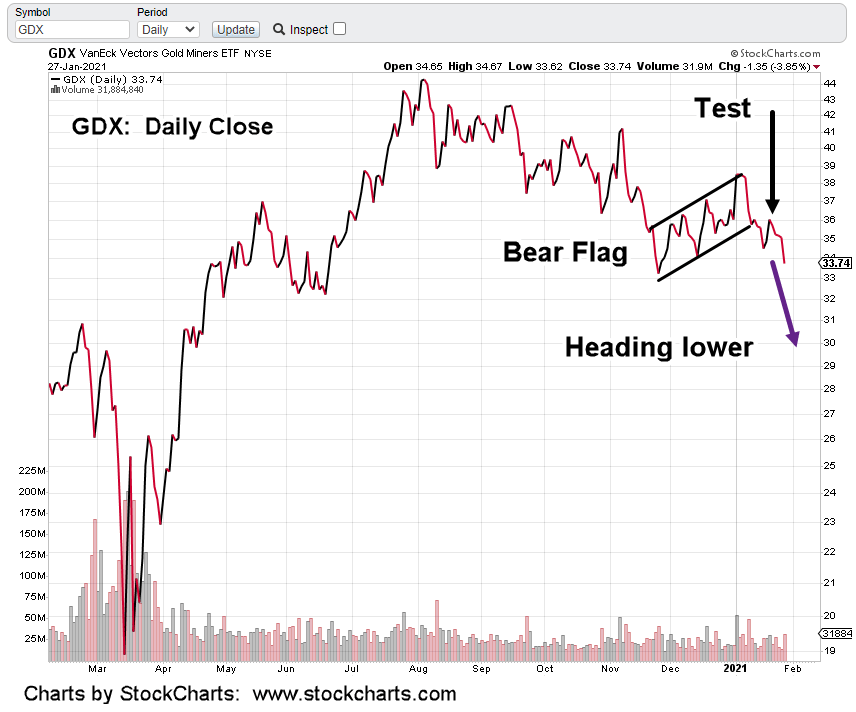
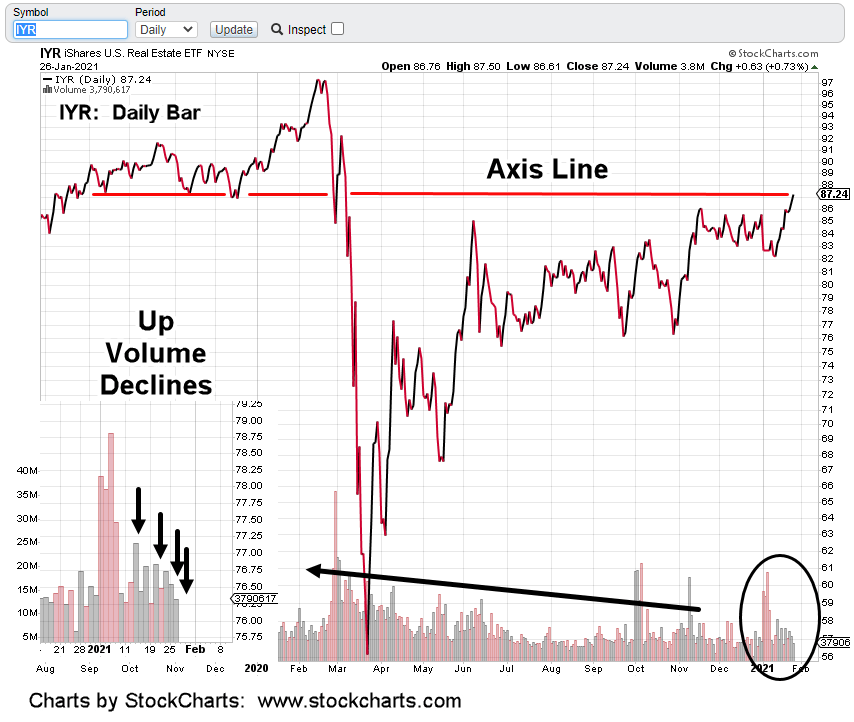
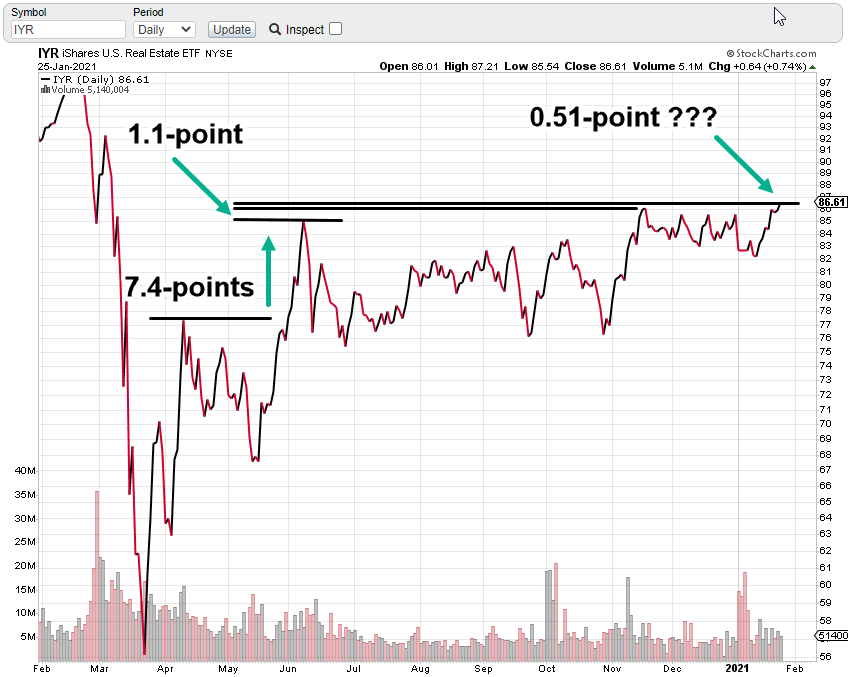
Commodities (like oil) along with real estate, one of the most illiquid of all markets, get crushed in a downturn.
Stay Tuned
Charts by StockCharts