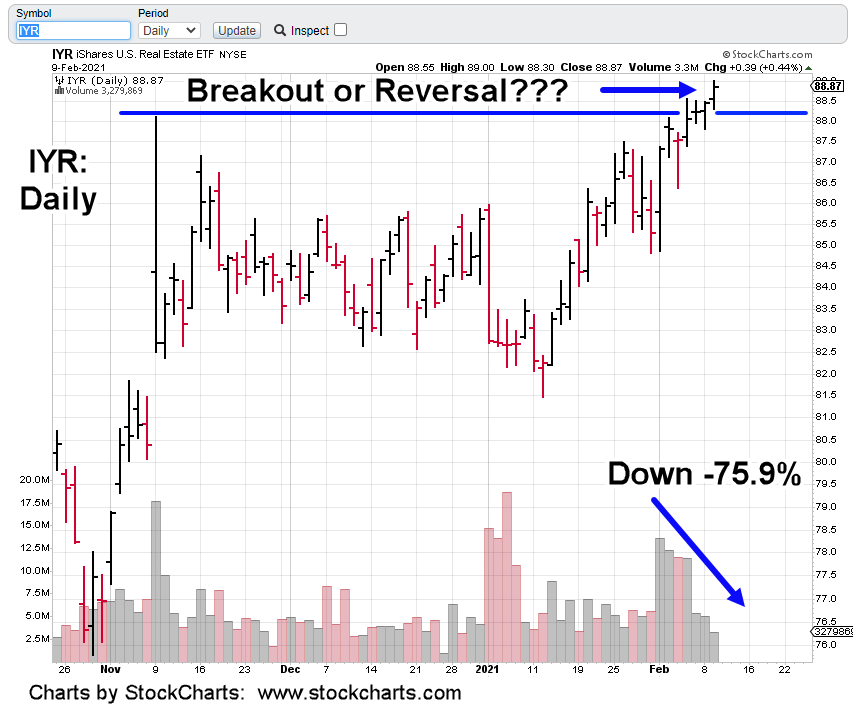
Yesterday’s action in IYR, looks like a breakout higher.
That is, until you look at volume.
Price action levitates higher while everyone leaves the party.
From the start of the last thrust higher on February 1st, volume has declined over 75%.
There are two possibilities:
Buyers and Sellers are backing away; letting prices drift.
There’s no bullish commitment at these levels; reversal imminent.
Two quotes that accurately sum up the overall market situation; from Johnny Bravo and Steven Van Metre respectively:
‘One thing or the other, something’s going to break’
‘This is pretty dangerous stuff going on here’.
Before we wrap up, we’ll add just one more thing.
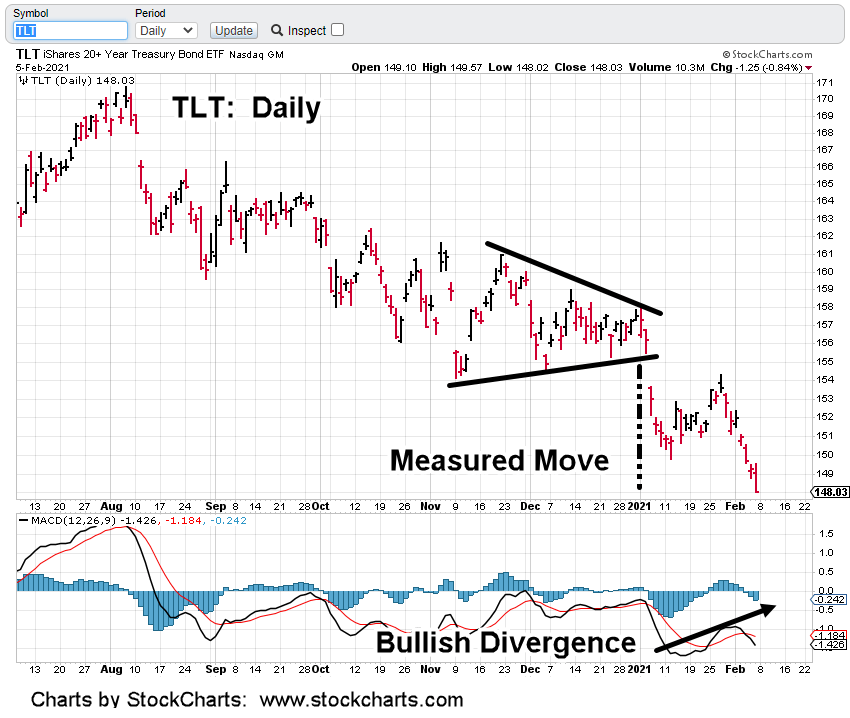
Junk yields have sunk to record lows.
Why buy TLT at ‘relatively’ safe 1.55%, when you can have junk yield at 3.95%, that’s going to blow-up (launching TLT into the stratosphere) at any time.
Note: Posts on this site are for education purposes only. They provide one firm’s insight on the markets. Not investment advice. See additional disclaimer here.
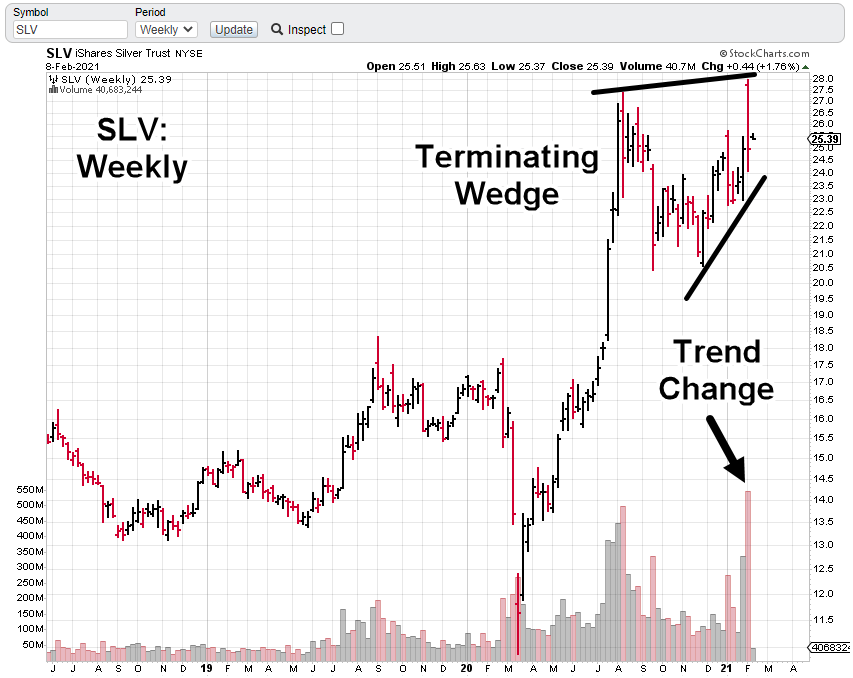
Massive volume in SLV, points to significant reversal.
Not since the week of May 13th, 2011 has there been higher volume.
The week prior in 2011, was the highest volume ever, for SLV at 1.1-Bilion shares.
Those two weeks culminated in a crash over -31% and were just after SLV reached its all-time high.
Total down-draft for the three weeks combined (the top and two weeks following) was nearly -34%.
Will it be any different now?
Probably not.
At this point, it’s important to re-state, this site is following principals and techniques set down by three market masters of the early 1900s; Livermore, Wyckoff and Loeb.
Markets do not change. Using the techniques outlined by those early masters are still applicable today.
Arguably, the father of technical analysis was Wyckoff.
The terms “accumulation, distribution, support and resistance” originated from him.
His technical publications had the largest subscriber base in the States at the time; larger than all other publications combined.
At one point he got so successful, his buy or sell recommendations were beginning to move the markets all on their own. The year was 1918.
Instead of stroking his ego on how ‘his recommendations’ were affecting the markets, he saw it as a disservice to his clients.
In May of 1919, he discontinued his newsletter publication ‘The Trend Letter’. It had become so popular, it was impossible to provide recommendations without those same tips moving the market.
What a contrast to today.
Those attempting garner forces (the little guy) to move the markets, such as silver, will find out soon enough who’s in control … and it’s not them.
It’s unlikely silver is going higher any time soon. There could be some upward spasms as the crowded trade exhausts itself; it’s likely we’ve seen the SLV highs for quite some time.
Note: Posts on this site are for education purposes only. They provide one firm’s insight on the markets. Not investment advice. See additional disclaimer here.
Note: Posts on this site are for education purposes only. They provide one firm’s insight on the markets. Not investment advice. See additional disclaimer here.
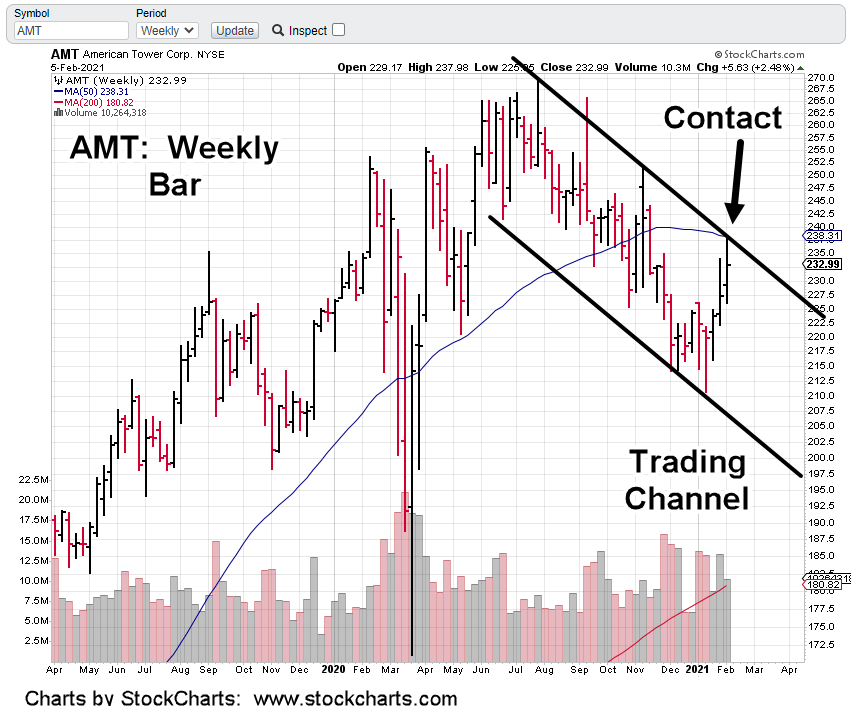
The largest cap equity in the real estate sector IYR, is American Tower Corp. (AMT).
We’re going to spend some time dissecting this equity but first, let’s look at the big picture (above).
The same chart is posted below having two areas highlighted with blue circles.
Zooming into the upper-right circled area (shown below). The circle has been removed to help provide clarity on the technical situation:
Next, we’re going to add a trading channel to the chart:
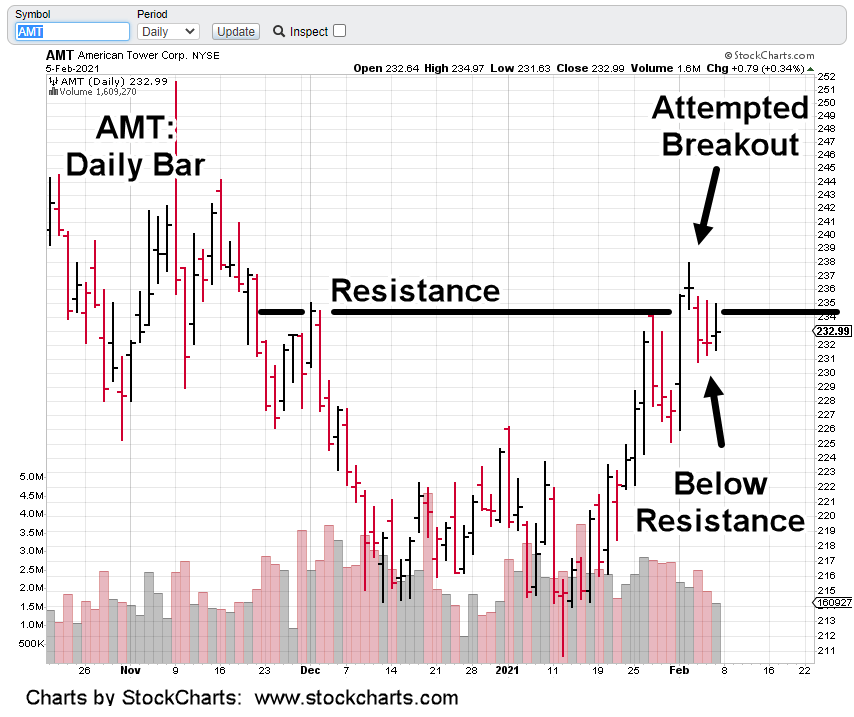
Now, we’ll zoom into the daily charts:
Drilling down even further on the daily:
From a fundamental standpoint, AMT has a P/E of 55, and is yielding an anemic 1.94% (as of 2/5/21, bigcharts).
That compares to a current TLT, yield of 1.55%
The last three earnings releases have each been downward surprises; averaging -6.6%, against expectations.
Getting back to the technical condition.
The second weekly chart had two areas circled. These are the only two places (in over fourteen-years of price action), where the 50-Week MA is pointed down at similar angles.
The first circle, AMT was rising into the declining MA as part of a long term bullish reversal.
The proposition at this juncture, based on fundamental and technical conditions, AMT is rising into a declining 50-Week MA as part of a long term reversal to the downside.
Price action is the final arbiter. Anything can happen.
The next earnings release for AMT is scheduled for February 25th (Yahoo Finance) so it’s not going to be a near term factor.
The expectation for the coming week; AMT continues its reversal and takes the IYR sector with it.
Note: Posts on this site are for education purposes only. They provide one firm’s insight on the markets. Not investment advice. See additional disclaimer here.
Note: Posts on this site are for education purposes only. They provide one firm’s insight on the markets. Not investment advice. See additional disclaimer here.
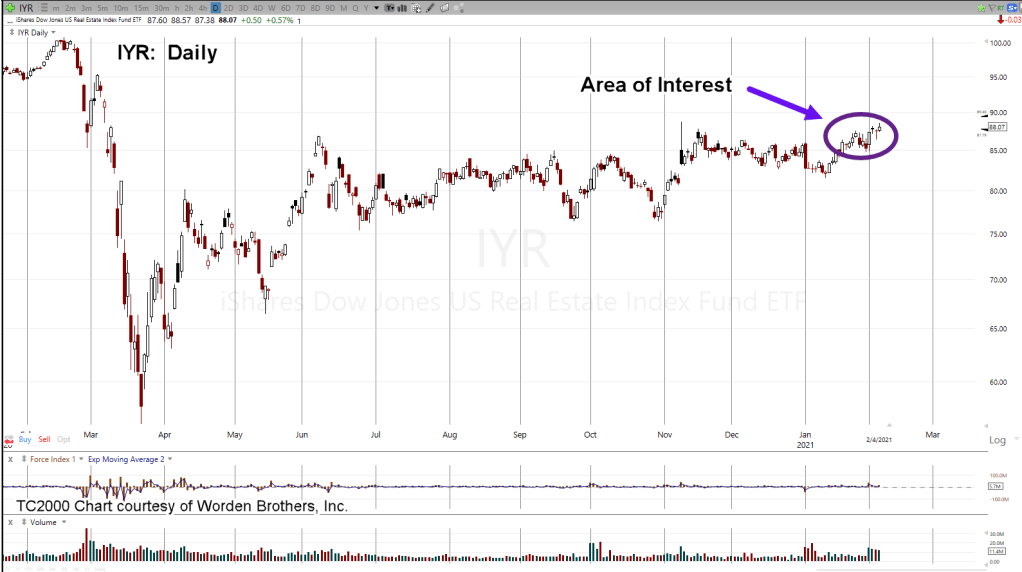
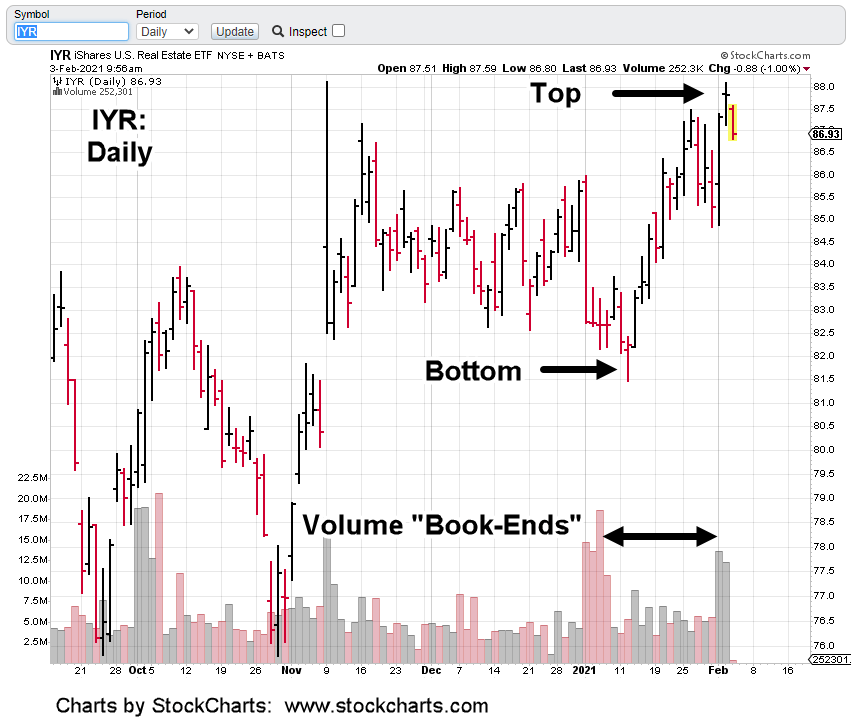
The final outcome. Real estate IYR has met key technical points that indicate reversal is imminent. It might not be much of a turn at the start, but the market rarely announces its intent.
Time spent analyzing real estate seems like forever; it’s actually only been a few weeks. The daily chart above, puts it into perspective.
For the most part, trading and positioning action has been focused on the tiny circled area. Not advice, not a recommendation.
To be concise, we’ll list the known facts about the current juncture.
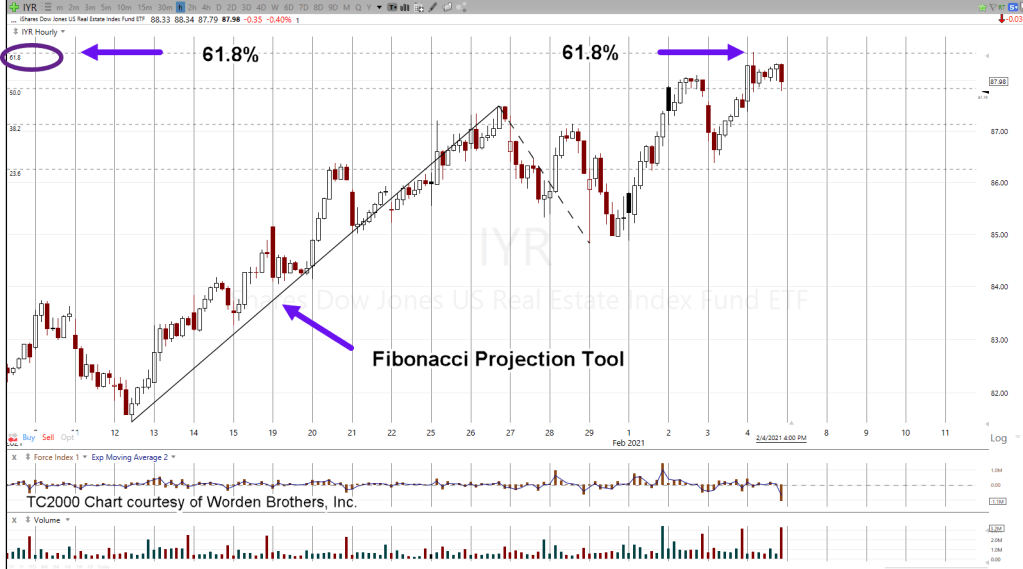
IYR is at Fibonacci 76.4%, retrace level from the down move that started in February – March last year.
Price action has met a Fibonacci 61.8% projected move off ‘a-b-c’ wave action from the January 12th, 2021 lows.
While meeting that 61.8% projection, price action formed a terminating wedge; complete with a throw-over early in the session yesterday.
Price action closed below the prior near time high of 88.11 (close was at 88.07).
High levels of volume over the past four sessions, indicate distribution; just as it indicated accumulation at the beginning of the current move. The “Book-Ends”
Successive lower momentum energy with each net upward close since April 9th, 2020.
Supporting the potential for market reversal, bonds are at short level (and price) extremes and the dollar has already reversed.
The area of interest shown in the daily above has been expanded to hourly charts below:
It may be a little hard to make out the Fibonacci numbers (61.8%, circled), but early yesterday, price action posted higher and reversed off the Fibonacci 61.8% level.
The hourly below, shows in addition to meeting Fib targets, a terminating wedge had also been formed:
The last chart, the daily, has IYR posting right at Fibonacci 76.4% retrace of the entire down move from February – March last year.
If IYR does not reverse at this juncture (or within tenths of a point), then it’s headed to much higher levels.
Considering all the facts; the extremes, bonds, dollar, and now gold and silver in a deflation impulse; significantly higher prices for IYR seem unlikely indeed.
Stay Tuned
Note: Posts on this site are for education purposes only. They provide one firm’s insight on the markets. Not investment advice. See additional disclaimer here.
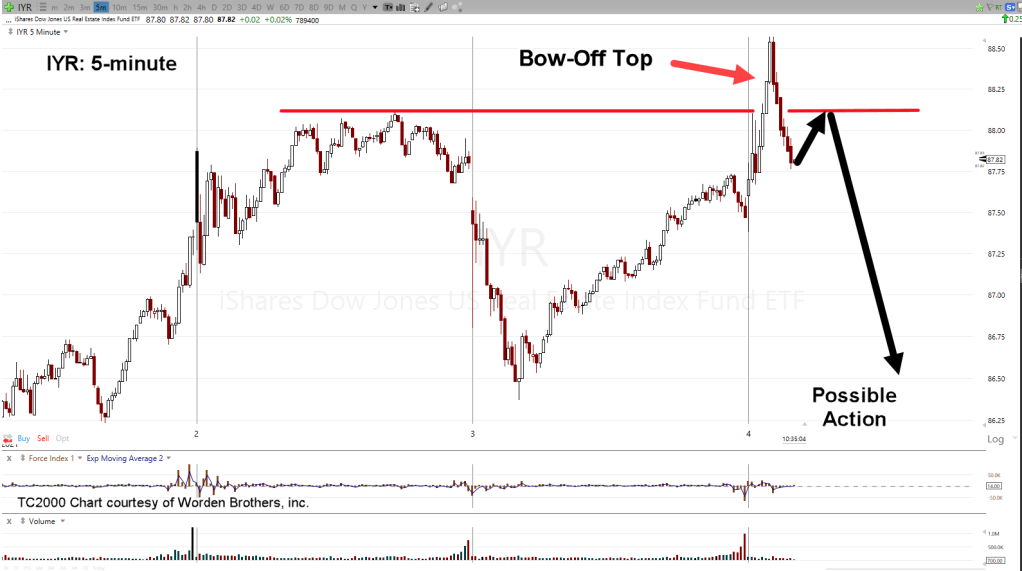
Showing signs of a blow-off top, IYR has reversed back below resistance. It may come up to test before heading dramatically lower.
The close of this session will be important.
Above resistance and IYR has a new lease on life. Below resistance and it’s likely we’ve seen the last of these levels for a very long time.
Note: Posts on this site are for education purposes only. They provide one firm’s insight on the markets. Not investment advice. See additional disclaimer here.
The daily charts show it’s clear there’s no more energy left to lift prices significantly higher.
Zooming in on the daily (below), momentum dissipation is evident:
Yesterday’s update said unless IYR posts a new daily high, it’s in reversal.
Price action came back late in that session to close the opening gap … but there was no new high.
The sector’s a juggernaut. When it reverses for good, downside action is likely to be as persistent as the upside.
In other but related markets, the dollar continues its upside reversal while gold and silver continue the downside.
The island gap-trap in silver, has now entered the disillusionment stage.
Retail ‘traders’ disillusioned about getting some tip in a widely followed ‘chat room’ that’s somehow going to make them rich by making only one decision (go long) and having little, or no experience.
Prechter said it well years ago: ‘Be sure to lose your fortune(s) early in life, so you have time to recover.
Even Van Metre’s getting heat and losing subscribers; the bond market’s not providing the necessary ‘good feelings’ for the inexperienced crowd to maintain a position longer than a few blips on the screen.
No matter the market, whether it’s bonds, gold, dollar, or real estate, the big money’s in the big move.
The most frequent condition of the market professional is one of ‘discomfort’.
If you need it, here’s a good source for help on mastering the emotions necessary to be consistently successful in the markets.
Note: Posts on this site are for education purposes only. They provide one firm’s insight on the markets. Not investment advice. See additional disclaimer here.
Note: Posts on this site are for education purposes only. They provide one firm’s insight on the markets. Not investment advice. See additional disclaimer here.
Just like book-ends. Volume showed the pivot higher (just over three weeks ago) as well as the pivot lower today.
For those following these updates, it’s no secret I’ve been positioning my firm, short the sector (over the past two weeks) via DRV; not advice, not a recommendation.
Everyone has their own style. I’d rather be early, than late.
Now, it appears IYR has reached its extreme and heading lower. With what looks to be an obvious reversal, position size will be increased as the market dictates.
Downside potential is absolutely massive but not guaranteed.
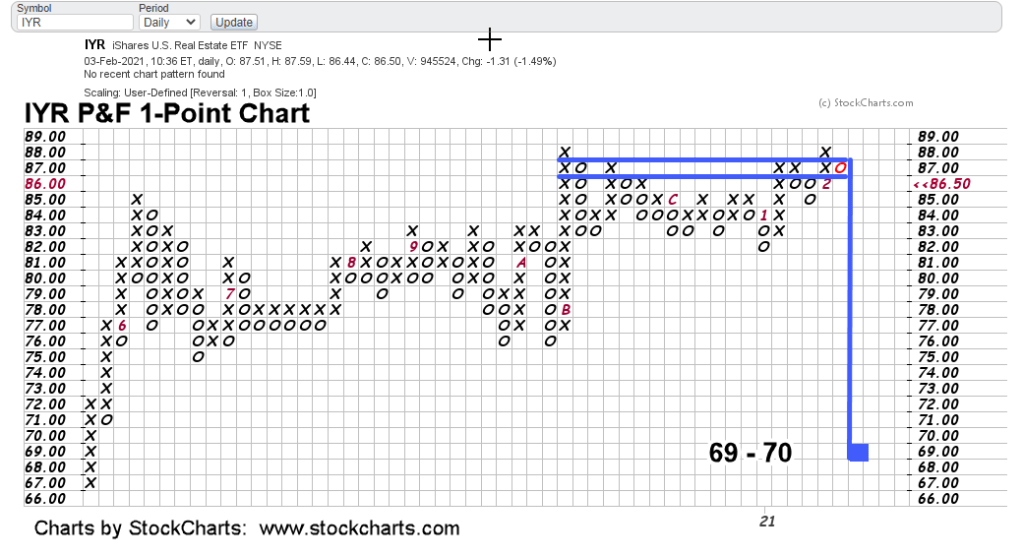
Price action posting higher has changed the Point & Figure projected targets. Forecast updates will be forthcoming.
Note: Posts on this site are for education purposes only. They provide one firm’s insight on the markets. Not investment advice. See additional disclaimer here.