Note: Posts on this site are for education purposes only. They provide one firm’s insight on the markets. Not investment advice. See additional disclaimer here.
A quick review of longer term momentum indicators on the major indices (or ETFs), below:
Technology based indices all have significant downside momentum.
The financial press may have pawned this off as ‘rotation’. Of course, that remains to be seen.
Our view, high yield tells us something much larger than a sector rotation’s occurring.
It’s possible, the most debt (interest rate) sensitive indices are reversing first which could be a sustained, long term reversal.
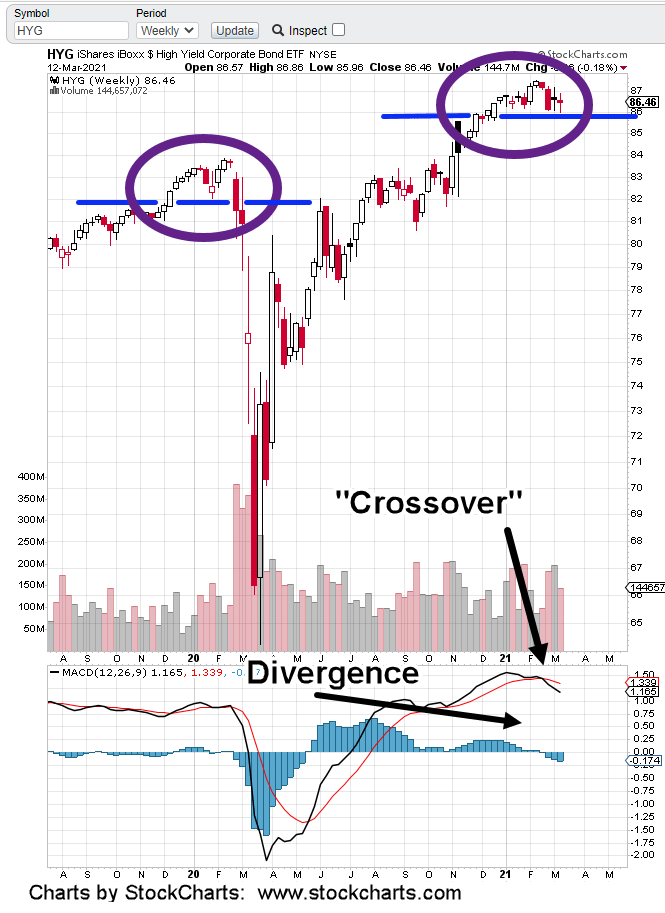
The HYG weekly chart pattern is similar to the prior reversal (magenta ovals). This time however, MACD has spent over nine-months in a divergence and has crossed to the downside.
There could be a new high … low probability but it could happen (after all, it’s at support). If it does, weekly MACD may post an even larger divergence.
In response to the HYG reversal, we’re watching (and are short) the biotech sector, IBB (not advice, not a recommendation)
Of the three noted above with negative momentum, IBB is the weakest. Last Friday’s action has tentatively confirmed the resistance areas and trading channel reviewed in this update.
Friday’s IBB lower action was nearly imperceptible but it was there. Major reversals can happen this way … a little at first.
Wyckoff said it in 1910, ‘It’s as if the weight of a feather can determine the next direction’.
We’ll see if there’s follow-through to the downside on Monday.
Note: Posts on this site are for education purposes only. They provide one firm’s insight on the markets. Not investment advice. See additional disclaimer here.
Price action has the final say. It’s saying not yet but close.
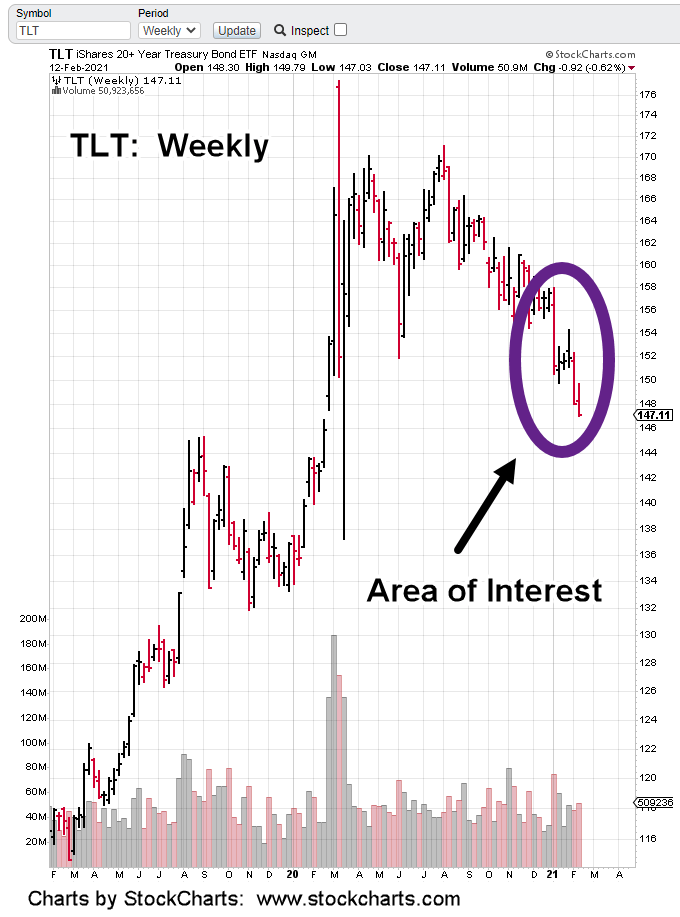
The weekly chart of TLT shows the area we’re going to look at a bit closer.
The chart has been expanded below:
In the past six weeks, there have been three decisive down weeks.
The black arrows on those weeks show each successive down week has less net travel.
Last week was the shortest net travel of the three. In addition, that week had higher volume than the week prior.
Less range, more volume.
The late David Weis in his Wykoff analysis video (link here) discussed a similar situation using Apache Oil (APA).
The short version of the story is: Less range, more volume … ‘somebody’s buying’.
Although not really a bond fan, the opportunity is there. Risk has been or is being removed (never entirely) and one way to participate in a reversal and bull move is using leveraged funds (not advice, not a recommendation).
This past Friday, I positioned the firm in TMF, a 3X leveraged bond fund.
Volume (liquidity) is acceptable at around 600,000 – 800,000 shares daily (allowing pre-market entries/exits).
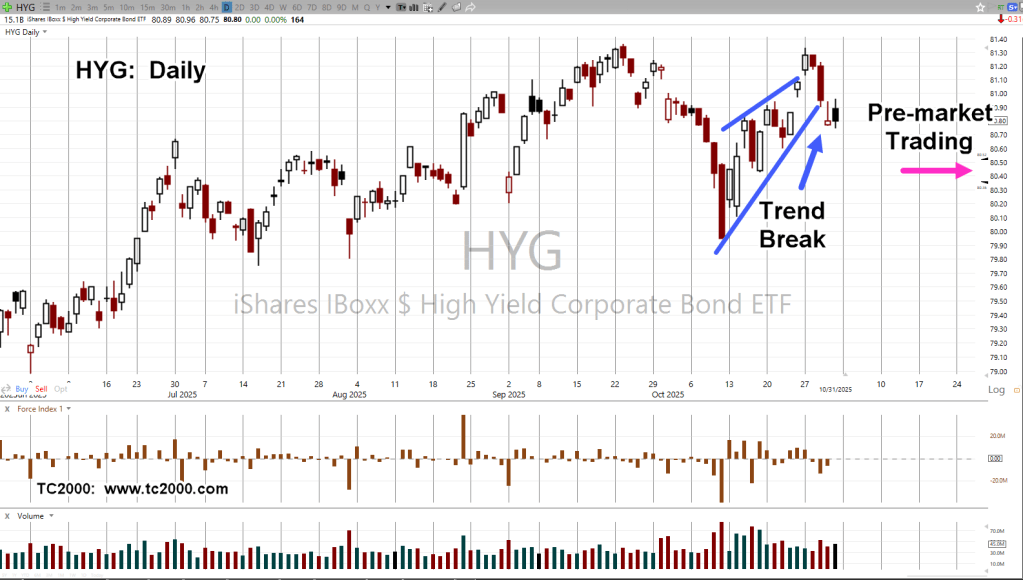
It’s important to note, while TLT was making new daily lows, the high yield HYG, ticked just 0.01-point above its post recovery high. Since August of last year, TLT and HYG have been inversely correlated.
On way to read this, we’re at extremes.
We’re just one ‘incident’ away from sending things violently in the opposite direction; complete with down-gaps, trading halts, brokerage lock-ups … the whole nine yards.
Note: Posts on this site are for education purposes only. They provide one firm’s insight on the markets. Not investment advice. See additional disclaimer here.
Note: Posts on this site are for education purposes only. They provide one firm’s insight on the markets. Not investment advice. See additional disclaimer here.