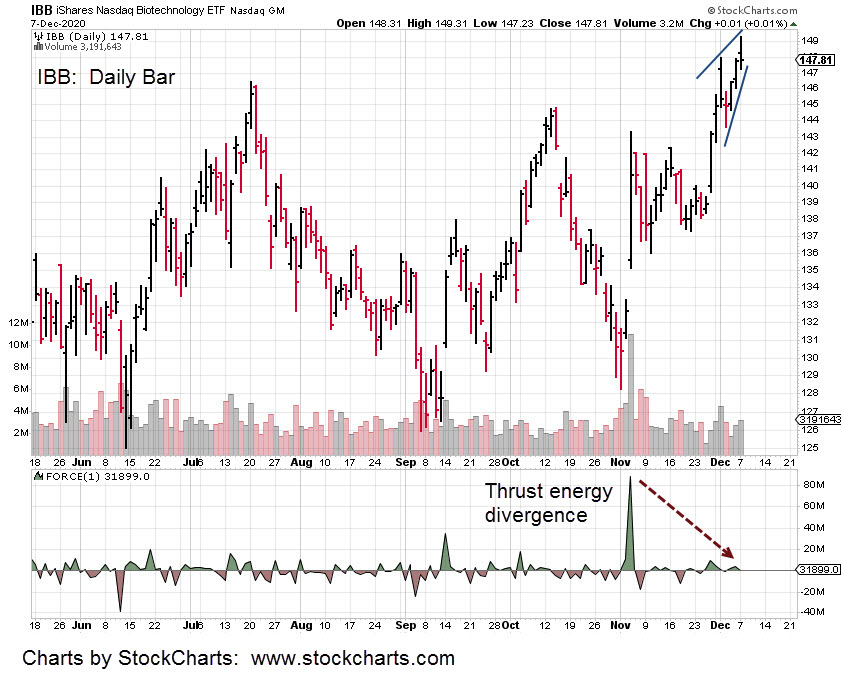
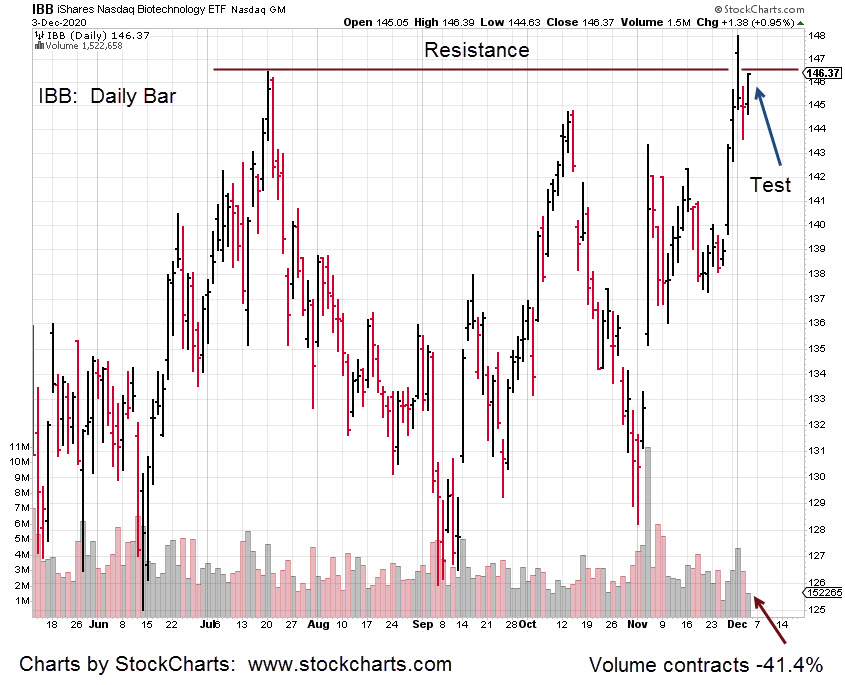
Culmination of probabilities; That’s what appears in Biotech, IBB
First: The 150 target identified in this post has subsequent price action reaching a 149.31, high … could be close enough
Second: The daily chart has a small terminating wedge pattern created over the last five sessions. A wedge is usually the last stop before reversal.
Third: The amount of upward energy (Force Index) available to push prices higher has evaporated. Today’s session, while closing marginally higher, had near zero energy.
Fourth: Today’s price bar was a reversal; A higher open, higher high, followed by lower low and lower close.
Fifth: The last reversal bar was five trading sessions ago. That bar was negated by subsequent price action; leading up to today.
Markets alternate. What happened the last time (negation of reversal) is not likely to happen this time.
Sixth … sort of. The gold market and the miners (GDX) could have received a ‘safe-haven’ bid in advance of an overall market decline. Did today’s rally in gold just signal the market top?
As of this post (8:02 p.m. EST) the overnight session (S&P) is trading lower -8.50-pts or -0.23%. So, we’ll see.
With the above five items listed and the probable sixth, expectations are for a lower open on tomorrow’s IBB session, then adding weight to the reversal.
Note: Posts on this site are for education purposes only. They provide one firm’s insight on the markets. Not investment advice. See additional disclaimer here.
If IBB is able to finish below resistance at 148, it will post a daily reversal bar.
Original upside target was the 150-area. Looks like at this juncture, 149.31 may be all there is.
Hourly chart of IBB with notes, below.
Positioned short (not advice, not a recommendation), via BIS and LABD (separate accounts).
Stop: BIS 24.64, LABD 27.63
Note: Posts on this site are for education purposes only. They provide one firm’s insight on the markets. Not investment advice. See additional disclaimer here.
It did not take long to be proven wrong. DUST positions (in both accounts) have been exited.
Stated before, a 23.6% retrace is a rare event. Looks like that’s holding true as price action for GDX now points to the 38.2% area.
That corresponds to GDX trading to around ~ 38 … a long way to go higher.
Biotech, shown below is just 0.69-pts shy of target with price action (as of 10:34 a.m. EST) coming back to test the early session lows.
It’s traders discretion (not advice, not a recommendation) to determine if today is the day IBB finally reverses and confirms the bearish weekly MACD divergence.
At this point, daily action has quickly retraced from the high of 149.31
Note: Posts on this site are for education purposes only. They provide one firm’s insight on the markets. Not investment advice. See additional disclaimer here.
At this time (9:07 a.m. EST) gold (GLD) is slightly higher, with lower action in miners, GDX and inverse fund DUST trading higher.
Probabilities for lower action in gold and miners assessed over the weekend in this report, appears to be correct.
Gold posted a new daily low but as the pre-market continues, price action is oscillating towards unchanged in both GLD and GDX.
The main point with the early session, gold has not made a new daily high in the overnight.
Whether or not we’re in a trading channel as shown in the DUST chart below, is unknown.
Price action itself will have to decide on the trend validity.
Market stop in DUST remains at 20.81 (not advice, not a recommendation) and will be moved higher to break-even as soon as possible.
The dollar is up slightly along with bonds. From Steven Van Metre’s report on Sunday, both remain at short-level extremes.
He also notes gold and the dollar are moving lower in tandem.
Something’s not right and one of the markets will likely respond and confirm the other.
Obviously, we’re ready and positioned for a dollar reversal (not advice, not a recommendation).
Note: Posts on this site are for education purposes only. They provide one firm’s insight on the markets. Not investment advice. See additional disclaimer here.
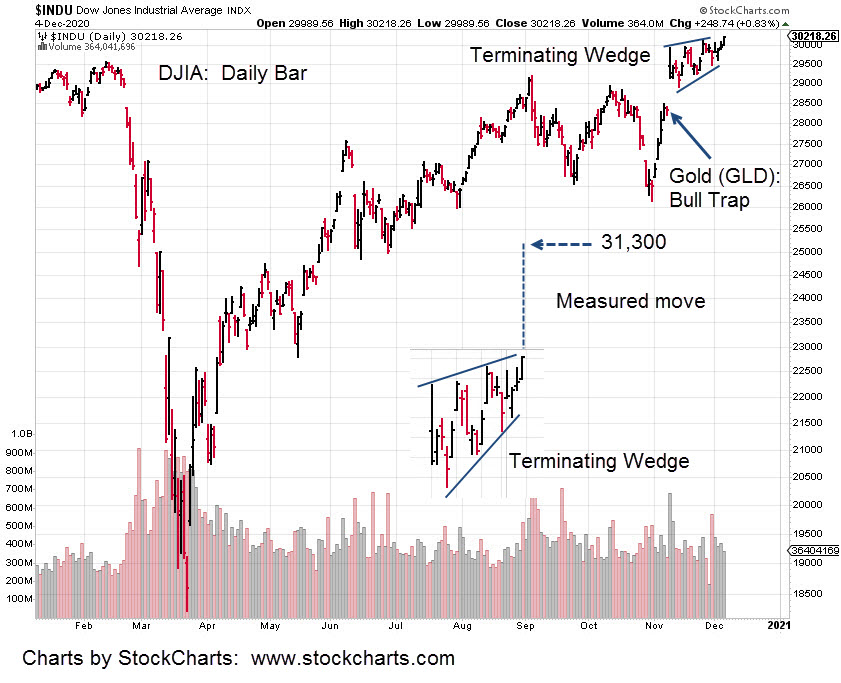
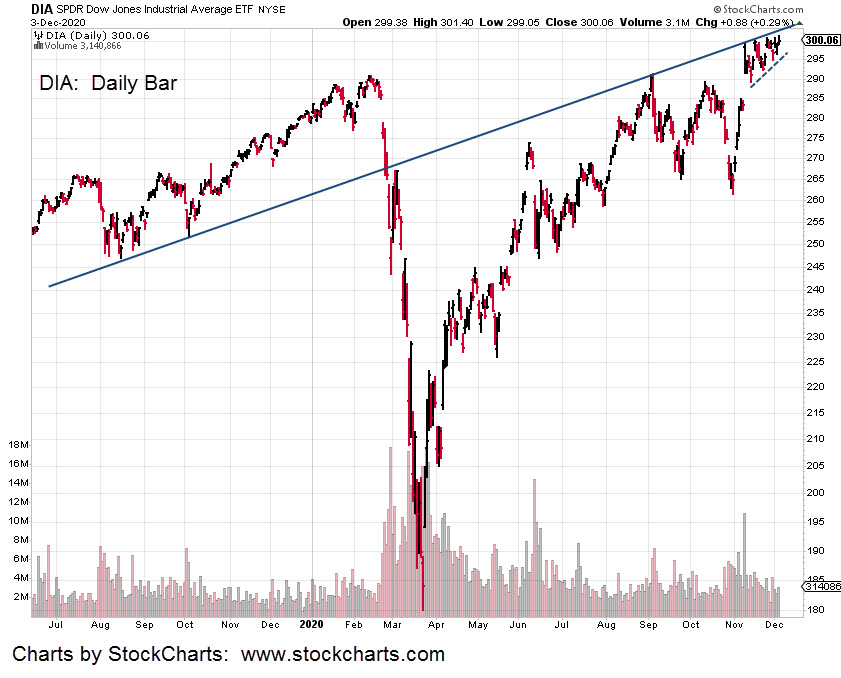
The Dow can either reverse right here or breakout higher from its wedge.
Since the trend is already up, a breakout to the upside is more likely. Such a move brings in a forecast to around 31,300.
The daily chart below has the last part of the wedge expanded and posted at the bottom of the chart.
Important to note is the location of the Gold (GLD) bull trap.
Recall, the firm went heavily short (via JDST) on that Friday and had to wait over the weekend to find out if the analysis was correct.
This excerpt (emphasis added) is from the November 7th, update. It was a Saturday; we’re already short and waiting.
“No doubt, there are a lot of well respected traders, analysts, YouTuber’s that are on the bullish side of the market. Here are just some examples, here, here, and here.
So, at this juncture, this firm is taking the opposite side of the trade with its re-established position in JDST.”
The following Monday in the early morning hours, gold prices collapsed. The bulls were trapped.
As the market opened with gold down hard, the Dow and S&P both spiked up in what’s now a terminal wedge.
‘Terminal’, because this type of price action typically comes at the end of a sustained move … up or down.
At this juncture, the firm is positioned short gold (via DUST) with a tight stop (not advice, not a recommendation).
The stops (two trading accounts short) are not mental, out of the market but are actual open GTC stop orders.
That way if there’s an internet upset or power grid problem, the in-the-market stops will provide some amount of protection.
All of the above may be an excellent analysis of current conditions.
However, behind the scenes, the macro or the real agenda, is deadly serious.
The ‘plan’ all along is to destroy (and subjugate) the middle class. That’s been in the works for decades. Neo Feudalism.
ShadowStats reports here, real unemployment spiked to 35% early in the year and has come down to just over 25% now.
That level is still above 1930s, depression-era numbers and we’re just at the first wave of middle class destruction.
Throw in more economic turmoil and a stock market crash. Then we have ‘fait accompli’. Only a tiny remnant could be left unscathed.
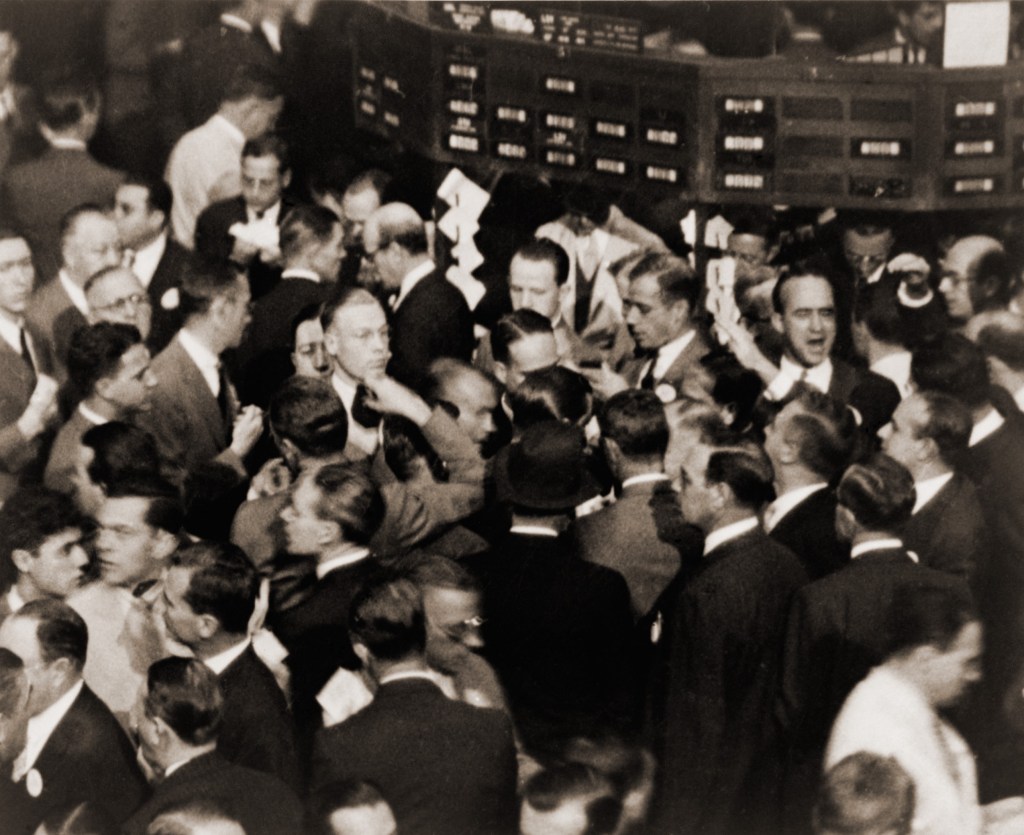
Note the picture at the top: The haves and have-nots.
From The Money GPS: ‘The chasm in-between the haves and the have-nots, grows every single day’
Self employment is the key. It’s not a guarantee but it does offer flexibility and most importantly it may offer some extra time.
The above statements may seem harsh (possibly outlandish) to those not yet awake.
To help in that area, two links are provided here and here. See for yourself whether or not we’re at a critical juncture.
Based on yesterday’s analysis, the expectation is for gold and the miners (GDX) to continue lower.
If they do and the markets (Dow, S&P) continue higher, it’s just one more indication the time for reversal is near.
Note: Posts on this site are for education purposes only. They provide one firm’s insight on the markets. Not investment advice. See additional disclaimer here.
The final arbiter is price action itself. We can analyze all we want but if the position does not cooperate, it’s time to leave.
Similar to closing nat-gas positions on November 3rd, as detailed here, it’s time to move on from Biotech; let it play out without us.
Biotech’s not working on the short side. So, we’ll come back when it is.
It’s important to note, after leaving UNG, it’s -21.2%, lower than November 3rd.
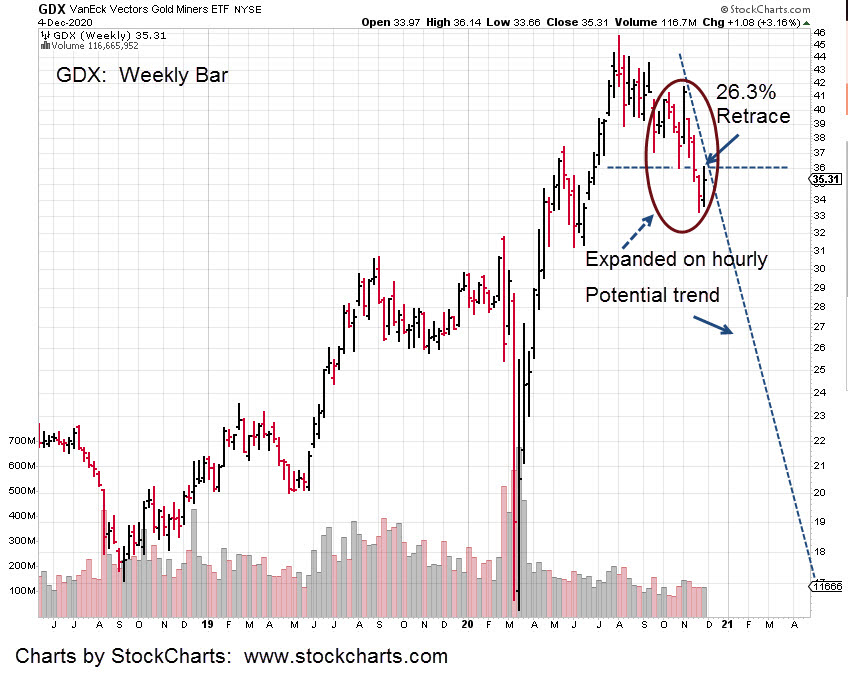
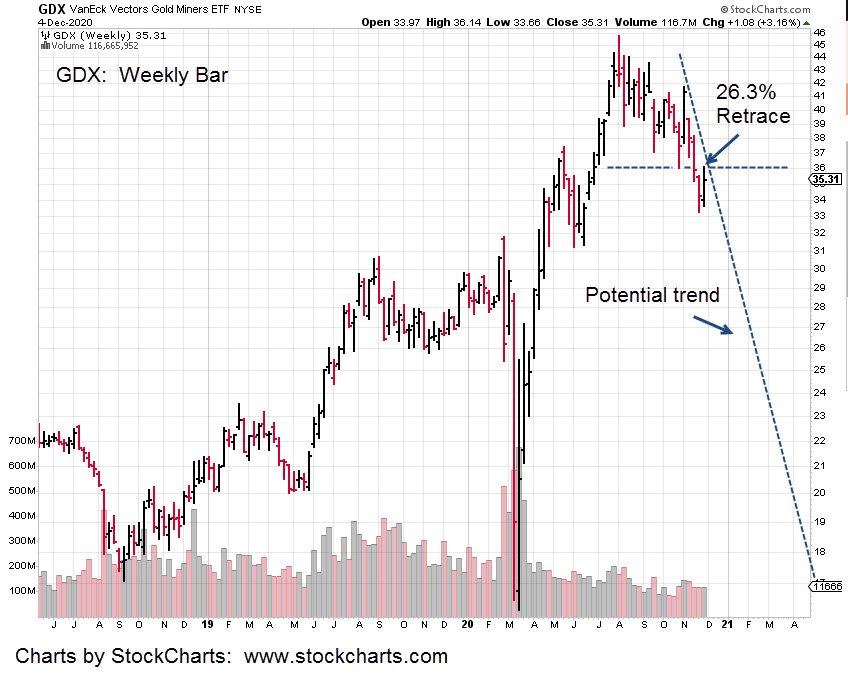
What’s working (for shorting), is gold and the miners (GDX) via DUST (not advice, not a recommendation). The GDX chart below shows the resistance level which is also the 23.6%, retrace.
A Fibonacci 23.6%, retrace is rare.
If that level is not challenged and GDX continues lower, the shallow retrace (to the upside) indicates significant weakness.
Recap: Markets (S&P, Dow, NASDAQ) at all time highs. The 30-yr Bond and Dollar, at short level extremes; the most in history.
Gold and GDX appear to be out in front, leading the way lower.
Note: Posts on this site are for education purposes only. They provide one firm’s insight on the markets. Not investment advice. See additional disclaimer here.
In the pre-market (8:52 a.m. EST) action continues to grind higher. Both the Dow and S&P have posted new highs thus negating the Holiday Turns scenario … but not by much.
Important to note is each market continues to post on the underside of a long-term trend-line. The Dow chart (DIA) is farther down this post.
Also added to the chart is the dashed trend-line underneath the recent price action. A wedge is being formed; typically last stop before reversal.
In other markets, looks like Biotech may continue higher but along with the others, action appears labored.
The short position could be stopped out at the open.
This area of price action is where cost of being wrong is least. We’re at The Danger Point.
Update: 9:04 a.m. EST: Both AMGN and MRNA have now posted lower in pre-market.
Stopped out does not mean there’s no opportunity. The bearish MACD divergence is still there.
If IBB continues higher, the original ‘150’ target is back in play.
The market extremes are still there: Bonds and the Dollar are short the most in history. Stretched all around.
It’s not unreasonable to expect several attempts to position short.
Note: Posts on this site are for education purposes only. They provide one firm’s insight on the markets. Not investment advice. See additional disclaimer here.
Note: Posts on this site are for education purposes only. They provide one firm’s insight on the markets. Not investment advice. See additional disclaimer here.
Instead of reversal in the overnight, gold went higher.
Keeping with the potential down-trend theme, we’ll pull out to the next larger time-frame; the weekly.
The 23.6% retrace level, is approximately 172.60 – 172. 70, when measured on the weekly chart. Pre-market action in GLD (as of 8:55 a.m. EST) is at 172.40 – 172.60 range.
So, we’re there.
This is a good example of price action coming back to test wide, high-volume areas such as posted last week. It’s what markets do.
From a trading standpoint, the DUST position could be stopped out if price action remains at this level to the open.
Not a problem. Every trading action results in creating another data point for a future entry.
Moving on to Biotech (IBB):
Using LABD (3X Inverse IBB) as the high-volume proxy, it’s oscillating in a narrow range and essentially unchanged.
Separately, David Quintieri at the Money GPS, comments here, that he’s being chided for not giving financial advice and not indicating which stocks to buy.
In addition, Steven Van Metre, in this report states the Dollar and 30-Year Bonds are shorted to unbelievable, historic extremes.
He also states that ‘when the market finally reverses, it’s going to be violent.’
The wipe-out, when it comes will likely be on several fronts.
Note: Posts on this site are for education purposes only. They provide one firm’s insight on the markets. Not investment advice. See additional disclaimer here.